Dell XPS 15 9530 Review: A Beautiful, Power-Efficient Laptop
Dell XPS 15 (9530): System, Gaming And Battery Benchmarks

Now it's time to see how the Dell XPS 15 9350 performs. Our review unit came to us running Windows 11 Home version 22H2. Before running any of our benchmarks, we apply all of the latest Windows and driver updates to the system we are testing. This laptop was pretty up-to-date as far as Windows goes, but did have one firmware/BIOS update that needed to be installed along with a few driver updates. Other than applying any available Windows updates and drivers, we run all of our tests with out-of-the-box settings to give prospective buyers an idea of what to expect. One exception was that we utilized the available thermal profiles within the My Dell app, which can have an impact on performance.
We ran all of our benchmarks on the Optimized and Ultra Performance settings. Ultra Performance trades heat and fan noise for the very best performance possible. We didn't really hear a huge difference in fan noise, but it also really did not make a big impact in terms of absolute performance, either. Remember, the XPS 15 is outfitted with lower-power hardware than high-end gaming machines like most of our competition. A 40 Watt GPU probably won't stand up to a 125 Watt model in terms of pure performance, for example, but it's also putting out far less heat. Hopefully the system makes up for that in battery life (which if you read the power and battery numbers in our 14-inch MacBook Pro review, you already know it's pretty darn good here).
According to Intel, the Core i7-13700H has a nominal TDP of 45 Watts and a maximum Turbo power of 115 Watts. Meanwhile, Intel's documentation put those numbers for the Core i7-13700HX at 55 and 157. That's a lot more heat to dissipate. All that is to say that we believe the cooling in the XPS 15 to be pretty solid for the power that it draws, and it's likely that performance didn't change much because the CPU and GPU were bumping up against power limits instead of thermal ones. This is the sort of thing that may have an effect on tasks that run for longer periods of time, and so we didn't expect something like Speedometer to show much change -- and it didn't, and out of sheer randomness it actually benchmarked just a hair slower a couple times. To illustrate this point, we included Ultra Performance in a couple of our longer-running tests, including PC Mark and a couple gaming benchmarks.
Enough with the setup, though, let's get onto the benchmarks.
ATTO Disk Benchmark
The ATTO disk benchmark is a fairly quick and simple test which measures read/write bandwidth and IOPS across a range of different data sizes. While we don't typically compare these results across multiple machines, it's useful to gauge whether a particular notebook's storage subsystem is up to snuff.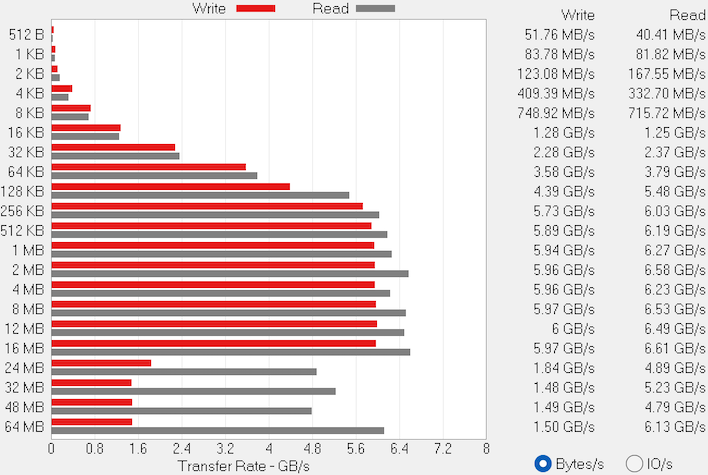
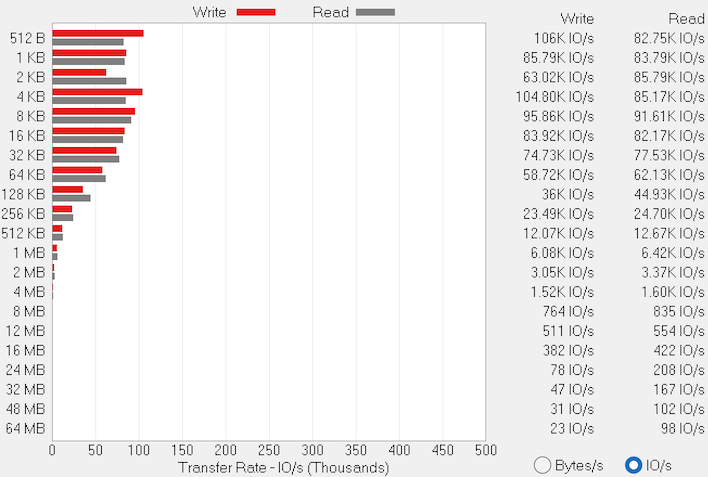
The Dell XPS 15 9530 configuration we tested has a fast SK Hynix PC801 SSD. This NVMe PCI Express 4.0 SSD could read sequentially at more than 6 GB per second, with darn near 6 GB per second on writes at the start of the test. Unfortunately, towards the end of the run, both of those figures dropped quite a bit. HWMonitor said the drive was not passing around 52-53 degrees Celsius, so we don't think that heat was an issue. More likely, it ran out of cache for those incredibly high writes and had to slow down. Even while it was working overtime to get that cache cleared, it was still reading at over 4.4 GB per second, even if 1.5 GB/sec writes were all it could manage. Raw IOPS were about what we'd expect from a consumer-focused drive like this as well.
Speedometer 2.0 Browser Benchmark
We use BrowserBench.org's Speedometer test to gauge our web experiences, which takes a holistic look at web application performance. This test automatically loads and runs several sample web apps from ToDoMVC.com using the most popular web development frameworks around, including React, Angular, Ember.js, and even vanilla JavaScript. This test is a better example of how systems cope with real web applications, as opposed to a pure JavaScript compute test like JetStream. All tests were performed using the latest version of Chrome.
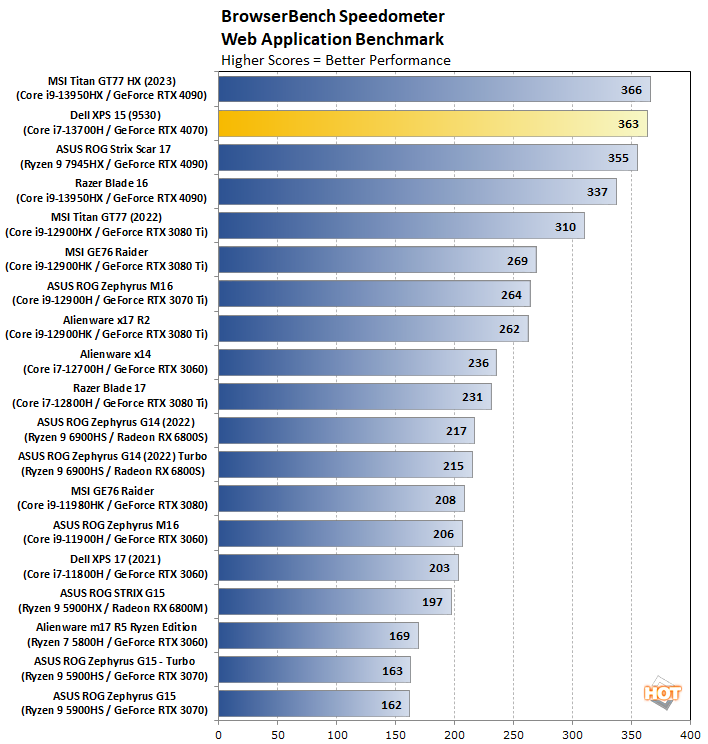
At this point, this test isn't much of a challenge for any modern x86 laptop, but the XPS 15 9530 absolutely shines, essentially matching the top-end performance of the MSI Titan GT77 HX. Even when for the fact that some of the machines on this list were using older Chrome versions when they were tested, and not the more recent releases, the XPS 15 all by itself accomplishes more than 360 runs per minute on this benchmark, meaning an average of around 6 runs per second. That's more than enough to make the vast majority of websites and even the most crudely-coded webapps feel brisk and responsive.
Cinebench R23 Rendering Benchmark
This is the latest 3D rendering benchmark from Maxon, based on the Cinema 4D R23 rendering engine. We tested both single-threaded and multi-threaded tests on all of the notebooks represented here...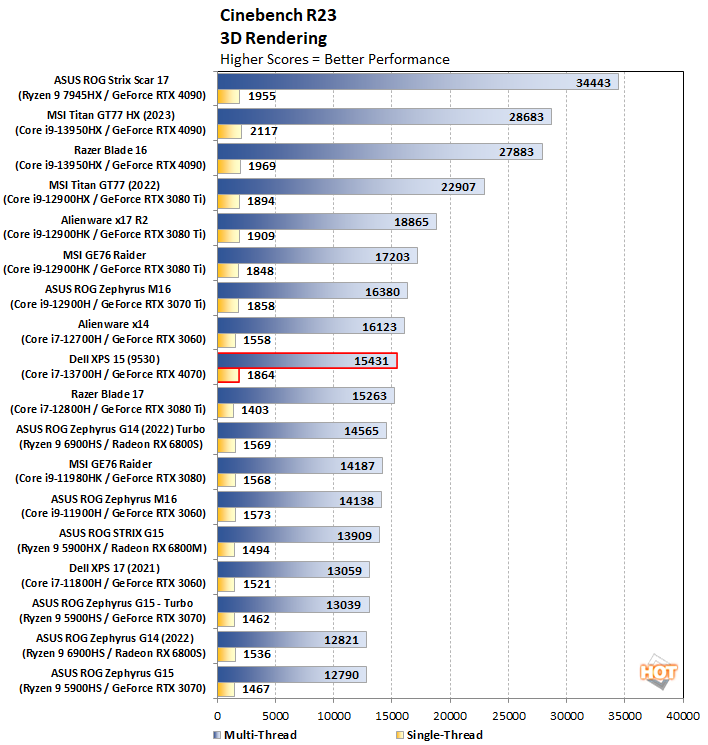
Considering the thermal budget, the XPS 15 9530 does quite well here. The single-threaded performance on this test is in the upper echelon of machines we've tested, going toe-to-toe with even top-end machines like the Razer Blade 16. Mutli-threaded performance drops back down to earth, partly due to the lower 45-Watt TDP of the Core i7-13700H, and partly because it just doesn't have the sheer core count of the Razer's Core i9. A pretty good showing, all things considered.
Geekbench 5 Benchmarks
Geekbench is a cross-platform benchmark that simulates real world processing workloads in image processing and particle physics scenarios. We tested the notebooks featured here in Geekbench's single and multi-core workloads. It measures single-threaded performance allowing a single core to stretch its legs, and multi-threaded throughput to put all cores under a heavy load.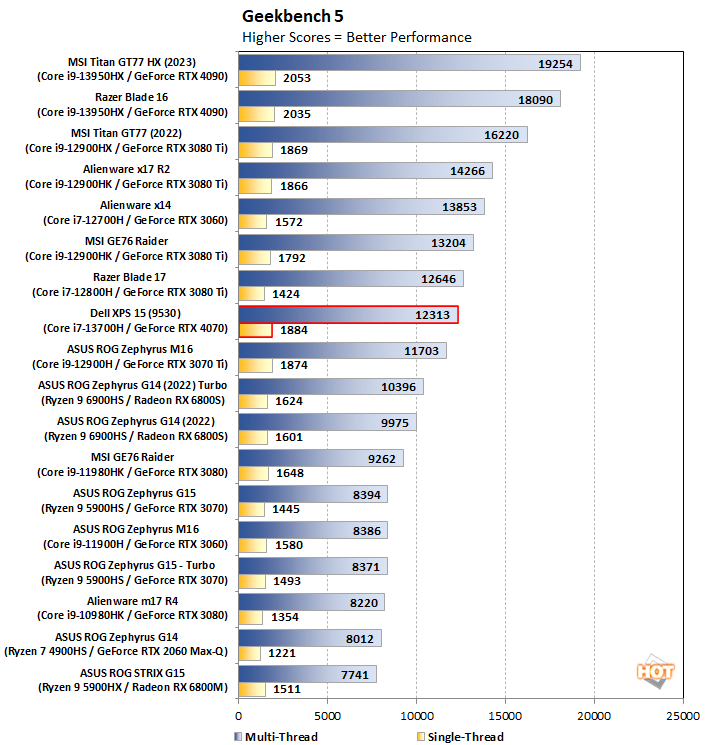
The XPS 15's single-threaded performance is really great just as it was in Cinebench. And once again, considering the lower thermal budget afforded to the Core i7-13700H, even the multi-threaded performance is very solid.
PCMark 10 Whole System Benchmarks
PCMark 10 uses a mix of real-world applications and simulated workloads to establish how well a given system performs productivity tasks, including image and video editing, web browsing, and OpenOffice document editing. While these scores appear to be all over the place, the systems are sorted by their overall PCMark score, which is the third (gray) bar in each cluster.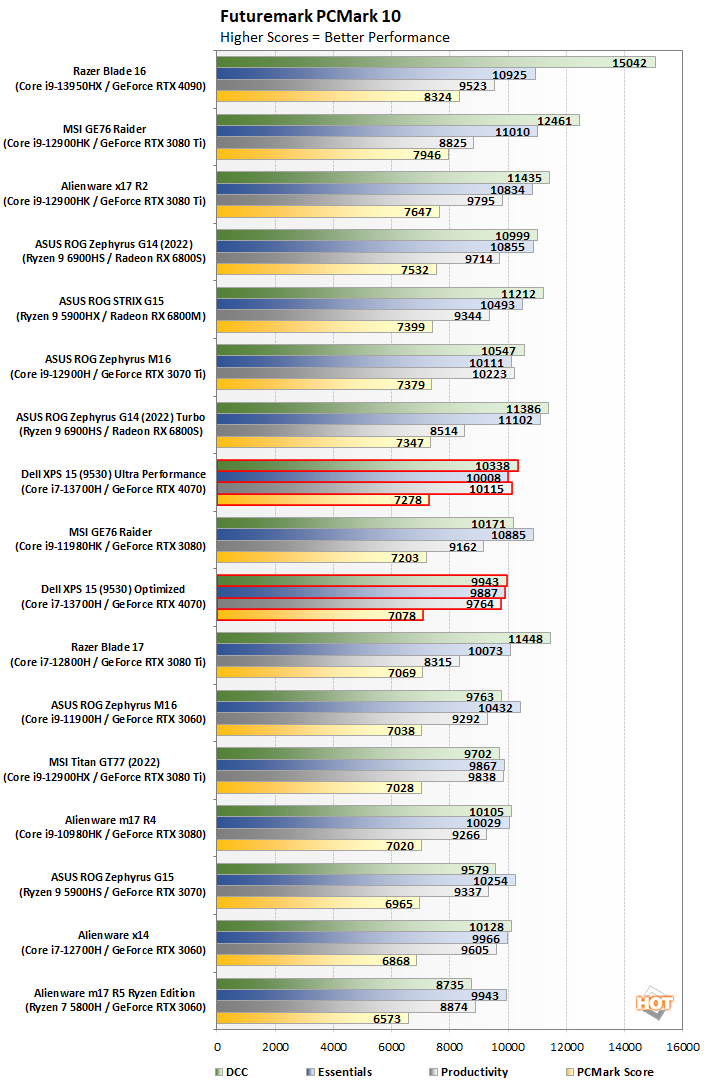
The XPS 15 does relatively well on PCMark, ending up in the middle of our pack. This test has a much longer runtime than our others, so it was a good candidate to see whether Ultra Performance mode in the power settings of the My Dell app. And as we've kind of addressed earlier, it doesn't make a huge difference. It's definitely faster, but the extra heat and noise doesn't really result in substantially better performance.
The point of the XPS 15 is that it's a more portable and thin workstation than the extra-bulky gaming laptops, and some of that trade-off is realized in the form of performance and power consumption. As a result, this machine ends up where we'd expect it based on those factors, so there's no reason to be disappointed here. That said, those bulkier gaming machines like the MSI GE76 Raider are faster overall by upwards of 20%. It's something to bear in mind when buying a machine, as these kinds of trade-offs are the biggest factor when choosing a system. Regardless, the new XPS 15 still offers great performance considering its size and weight class.
3DMark Graphics And GPU Tests
3DMark has several different graphics tests which focus on different types of systems. We start with Time Spy, which was 3DMark's headline benchmark until just recently. This test presents a pretty significant challenge for the system's CPU and GPU using the DirectX 12 API...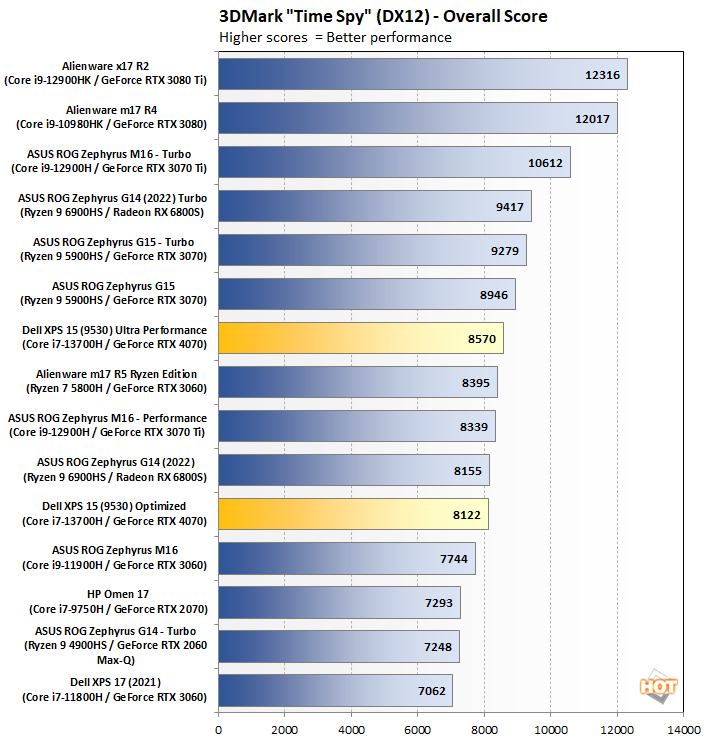
Due to the low-power 40 Watt configuration of the GeForce RTX 4070, performance here isn't exactly great. Every other laptop on this list draws anywhere from 50 to 200% more power (in the case of 125-Watt configurations) for its graphics processor. That's why the XPS 15 9530 trails the ASUS ROG Zephyrus M16's two thermal modes here. That machine gives a full 80 Watts to its GeForce RTX 3060 GPU, double the power to stretch its legs. The Razer Blade is twice as fast as the XPS 15 but it pulls so much more power and generates extra heat to do it.
Next up, let's take a look at the Extreme preset for the punishing 3DMark Fire Strike test. This DirectX 11 test has been around for a while, but it's still pretty challenging for mobile GPUs.
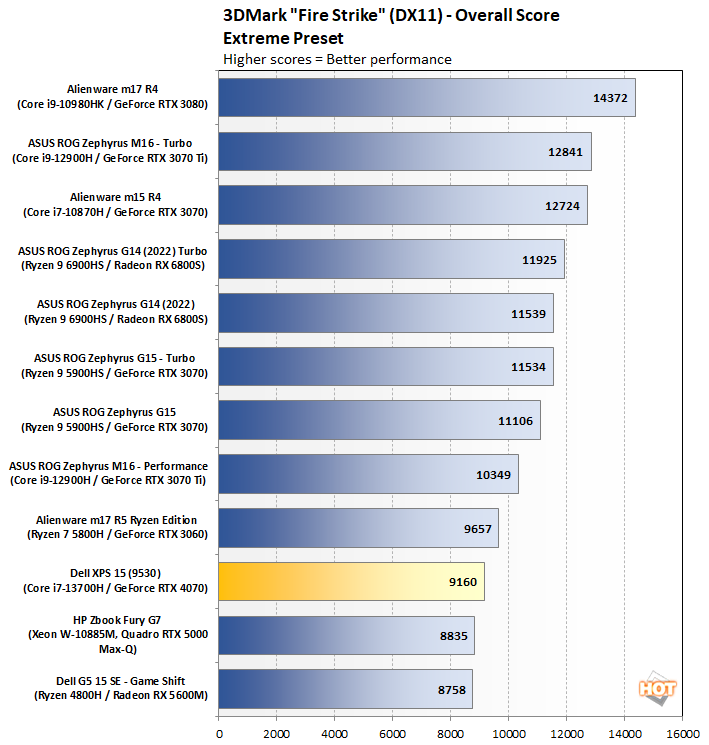
This older DX11 test is still a bit of a torture test for modern platforms. And again, the XPS 15 finds itself near the bottom. This is a DirectX 11 test, but honestly, DX11 is coming up on the end of its usefulness; nearly everything released these days that requires any sort of rendering and computational horsepower has long since moved on to DirectX 12.
Lastly, the Port Royal test uses DirectX Ray Tracing (DXR) along with traditional rasterization techniques to illuminate a scene...
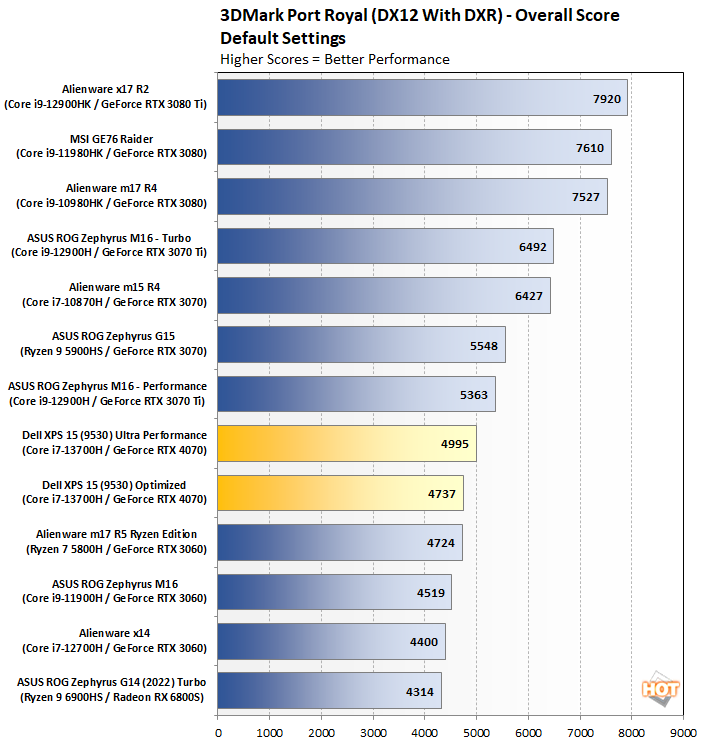
The RTX 4070's DXR performance is roughly on par with how it performed in the other 3DMark tests. It's again in the bottom third of the pack due to being hamstrung by a lower power draw. And as we'll see shortly, that's not necessarily indicative of poor gaming performance.
Middle Earth: Shadow Of War Tests
Middle Earth: Shadow of War is a fun and beautiful title set in Tolkien's Lord of the Rings universe. To test the game's performance relative to other systems, we set the resolution to 1920x1080 (or 2560x1440) and turned the visuals up to the High preset. The frame rates here are the average reported by the built-in benchmark.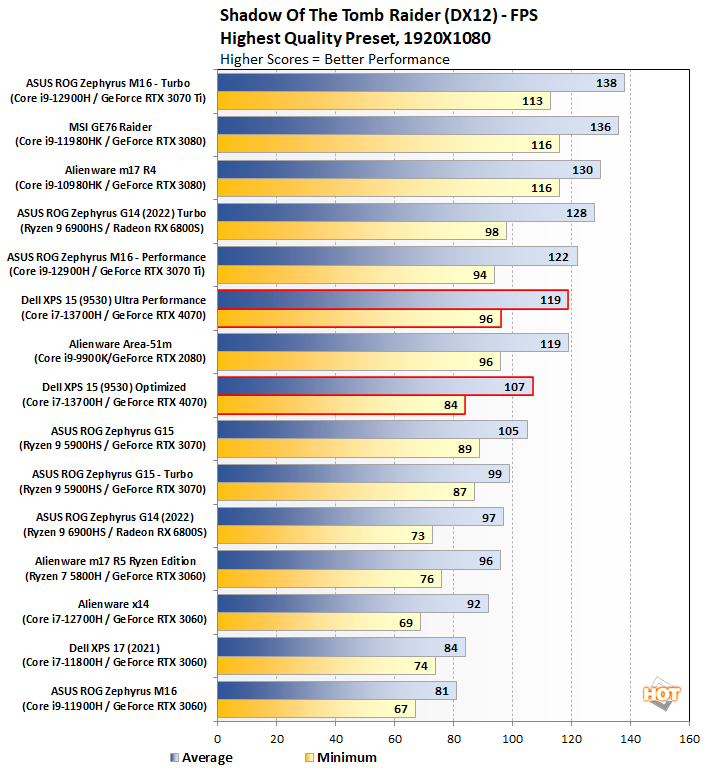
In the first of our actual game tests, the lower-power GeForce RTX 4070 in the XPS 15 acquits itself nicely. The fact that the machine has enough performance to max out the 60 Hz display, even at a lower resolution than its native 3.5K, is extremely important for a smooth gaming experience and it does a great job. The primary function of the XPS 15 isn't a gaming machine, but it's not like it's slow, either.
Shadow Of The Tomb Raider Benchmarks
The finale in the rebooted Tomb Raider trilogy, Shadow of the Tomb Raider is easily the best-looking of the bunch. It's also brimming with Tobii eye-tracking hardware support, and leading-edge graphics technologies. To test this game out, we again turned the visuals up to their highest preset and tested at the FullHD resolution of 1920x1080, and again at 2560x1440.
F1 2021 Benchmarks
F1 2021 supports DirectX 12 with ray tracing, and it incorporates support for a number of AMD's FidelityFX Super Resolution (FSR) and NVIDIA technologies (like DLSS). We tested the games with its Ultra High graphics preset, with ray-tracing and TAA enabled at a couple of resolutions to see what the Razer Blade 16 could do...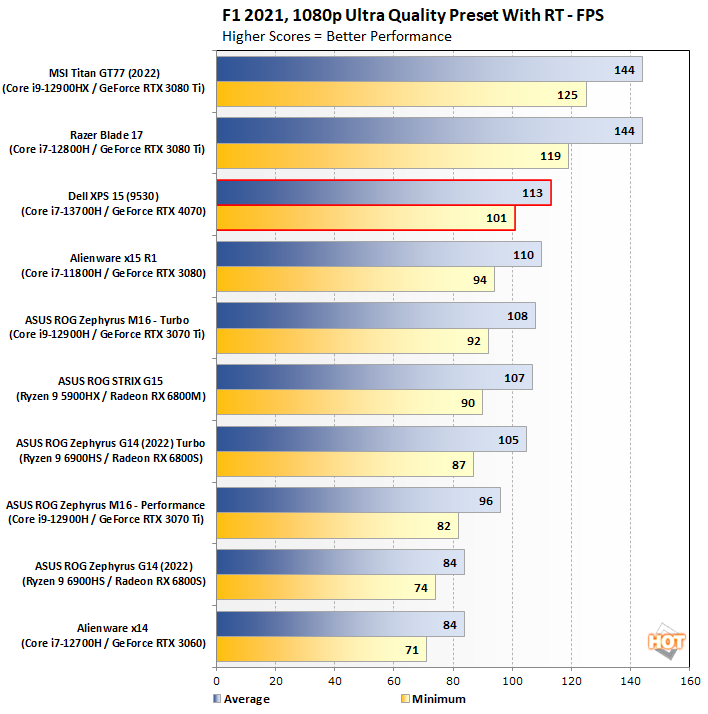
Marvel's Guardians Of The Galaxy
Marvel’s Guardians of the Galaxy is an action-adventure game where you play as Star-Lord and lead the rest of the Guardians from mission to mission. The game’s minimum requirements call for a Radeon RX 570 or GeForce GTX 1060-class GPU, but it also supports some of the latest graphics technologies, including DXR and DLSS.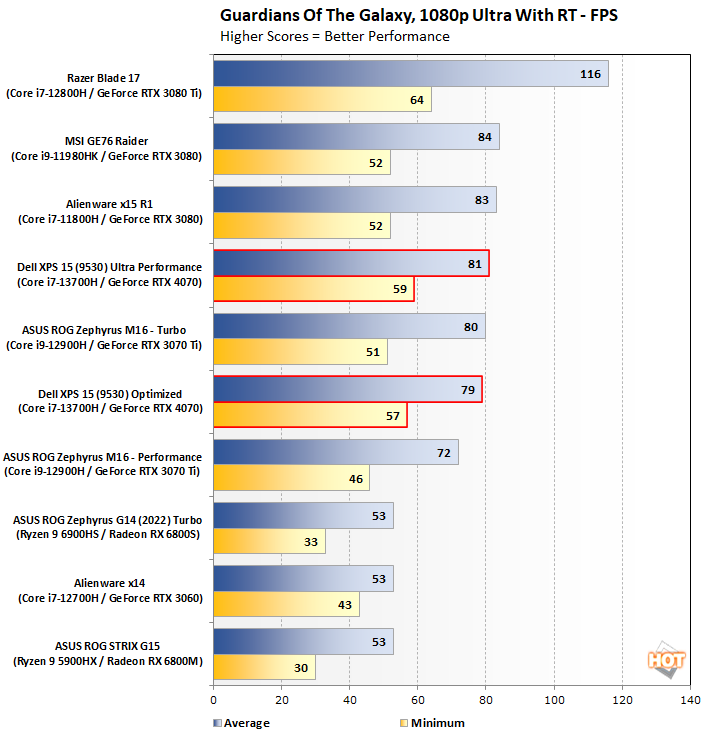
Next up, let's take a look at battery life and check out the insides of this machine to see if beauty goes beyond skin deep.


