NVIDIA Reviewer Toolkit: Preparing For Ampere, Exploring Perf, Power And Latency
NVIDIA Reviewer Toolkit For Graphics Featuring LDAT, PCAT And FrameView GPU Analysis Tools

The NVIDIA Reviewer Toolkit is a mix of specialized hardware and software. It consists of the LDAT, or Latency & Display Analysis Tool, PCAT, or the Power Capture Analysis Tool and FrameView v1.1. The LDAT device is used to measure end-to-end system latency, sometimes referred to as input latency or motion-to-photon latency. To put that into layman’s terms, LDAT is able to measure the time it takes for a system to display and on-screen response to mouse input – for example, how long it takes for your gun to fire in a shooter, after clicking the mouse button. The PCAT tool is used to measure aggregate GPU board power being delivered not only through the PCI Express slot, but through up to three 6 / 8-Pin PCIe power feeds. To date, we have been reporting total system power with various components (like GPUs) under Idle and Load conditions, which is an adequate relative metric, but PCAT allows us to report actual GPU power through all of the delivery mechanisms, without influence from other components. And finally, FrameView v1.1 is the latest version of NVIDIA’s FrameView software tool, with some interface tweaks and the integration of data from LDAT and PCAT to tie everything together.
The Latency & Display Analysis Tool Hardware


LDAT Top And Bottom -- Yes, That's a 3D Printed Case
The LDAT tool is an interesting little device. It connects to a system via USB and features a photoelectric luminance sensor and a direct connection to the left mouse button in a Logitech G203 gaming mouse. An elastic band integrated into the LDAT device give users the ability to wrap it around a display and position the sensor over a small part of the screen. When connected to a system, with the lightweight companion app running, LDAT tracks the amount of time between a mouse click and a luminance change on-screen.
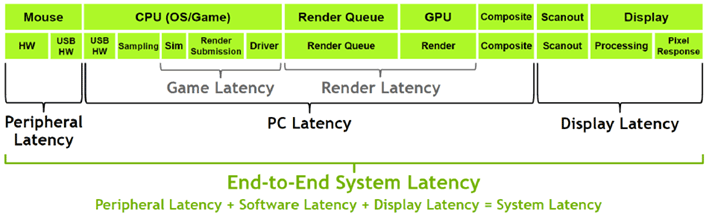
There are a multitude of factors that can affect end-to-end latency, from the mouse itself, to drivers, the game engine, GPU performance, the display and everything in between. The LDAT measures system latency beginning with the actuation of the mouse button switch and ending when the screen luminance under the sensor increases by at least 6% compared to its initial value – though this threshold can be tweaked. LDAT testing can be performed on a single system, but NVIDIA recommends that testing be performed with two systems, one running the testing software and the other actually running the games.

The Modded Logitech G203 Gaming Mouse
The Power Capture Analysis Tool Hardware


PCI Express Riser, Attached To The PCAT Interposer
The PCAT device is essentially an interposer that plugs in-line between a system’s power supply and the graphics card. There is a PCI Express x16 riser, that gets inserted into the slot on the motherboard. The graphics card gets inserted into that, and the riser connects to the PCAT board, along with up to three, 8-pin PCI Express power feeds. Commensurately, there are three PCI Express 8-pin power outputs on the PCAT board, along with a USB interface for connecting to the host systems and companion software.
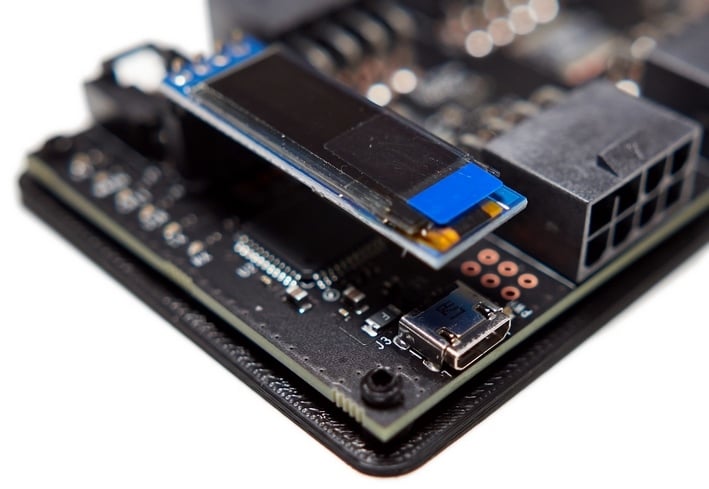
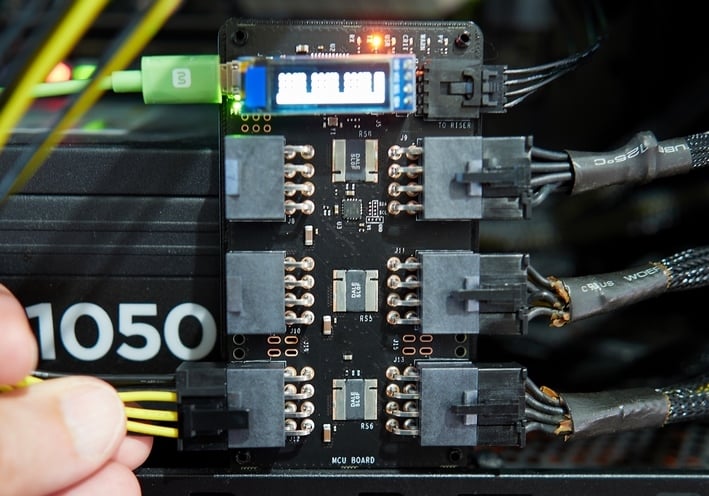
All told, the PCAT device can measure power traversing the PCI Express slot and the three PCI Express power feeds in real-time, and log the data. Like the LDAT utility, PCAT has a simple user interface that presents data in graph form, but all of the data can also be logged to .CSV for deeper analysis and comparisons. There is also an optional OLED display attachment that shows power data in real-time. The OLED display alternates between total power and power from the individual rails -- we've got some additional pictures below.
NVIDIA FrameView 1.1 Software New Features And Revisions
FrameView 1.1 is the latest version of NVIDIA’s frame benchmarking and power reporting tool. There are a number of new features in this update including:- Vulkan Overlay
- Rendering Present Latency
- CPU Clocks, Utilization, Temperature, and Power
- GPU Clocks, Utilization, and Temperature
- Full support for PCAT (Power Capture Analysis Tool)
- Power numbers from PCAT are logged in FrameView Log files with corresponding changes in FV overlay
- System parameters like CPU name, GPU name, API, Resolution (only for full-screen mode), OS, System RAM, Motherboard, GPU Base Driver, and GPU driver Package in log files
- Per-app log files for multiple runs
- Installer Support and UI improvements
- Expanded Excel Template for Charting

The FrameView 1.1 interface is clean and straightforward. Install the application, run it, set your hotkey and overlay options, and that’s about it. Like the other tools, FrameView will capture detailed data and log it to .CSV files, but the program’s overlay also presents summary data on-screen. If you’d like to test the performance of a game that doesn’t have built-in benchmarking tools, FrameView makes it quick and easy.
Over an above capturing data, NVIDIA also includes a number of preset templates for charting, graphing and comparing results captured with the Reviewer Toolkit.
What Kind Of Data Does The NVIDIA Reviewer Toolkit Provide?
In lieu of an in-depth GPU review (don’t worry – lots of those are coming), we wanted to present some data captured using the NVIDIA Reviewer Toolkit from LDAT, PCAT, and FrameView.This first set of screen captures shows latency data captured with LDAT, running Wolfenstein: Youngblood, at 1080p, with the highest-quality “Mein Leben” graphics options enabled on a Radeon RX 5700 XT and a GeForce RTX 2080 Super.


GeForce RTX 2080 Super (Left), Radeon RX 5700 XT (Right)
These results shouldn’t be directly compared (we were experimenting with sensor positioning with the GeForce installed – hence the much large standard deviation) and are presented just to give you an idea as to what kind of data is captured and reported. Minimum, Maximum, and Average end-to-end latency are captured and graphed, though additional modes – including an Audio latency test – are also available.
For this set of tests, the LDAT sensor was positioned on our display, just off to one side of the gun’s barrel. After clicking the mouse button (or using the auto-fire feature), the moment a muzzle flash is detected on-screen, the LDAT sensor captures the length of time between the mouse click and muzzle flash (i.e. the latency) and logs it. Seems simple enough, but building the tools necessary to capture this kind of information is anything but, for the average tech geek.
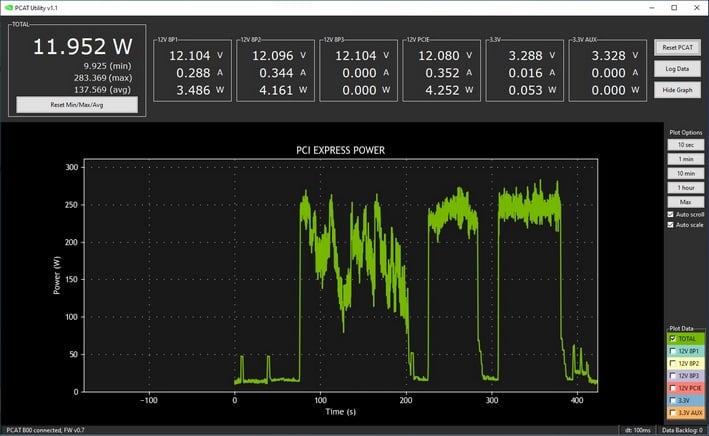
GeForce RTX 2080 Super Power Running 3DMark Time Spy
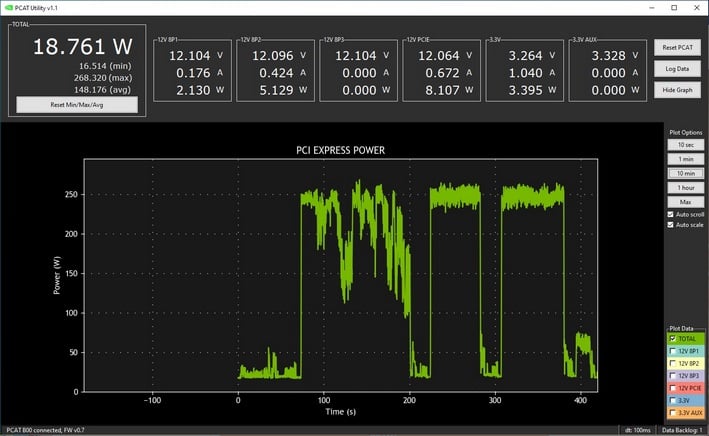
Radeon RX 5700 XT Power Running 3DMark Time Spy
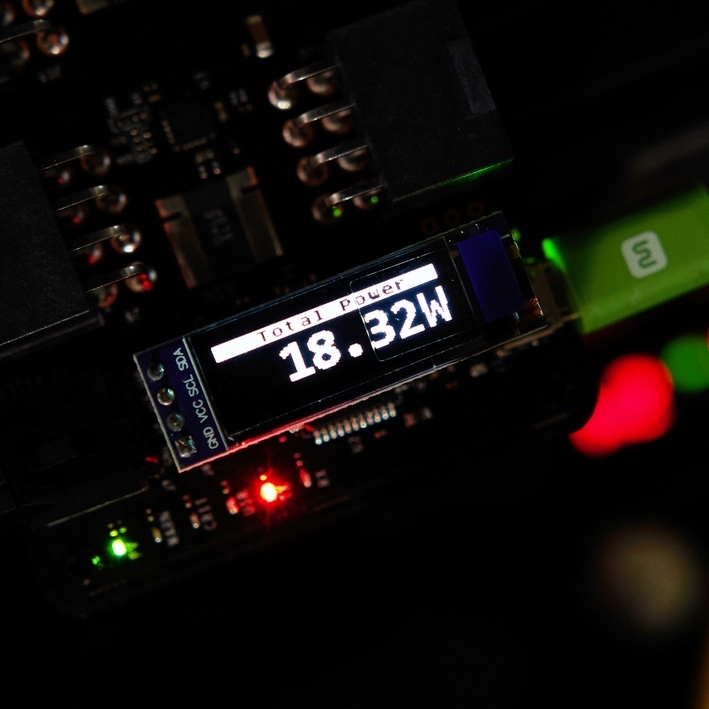
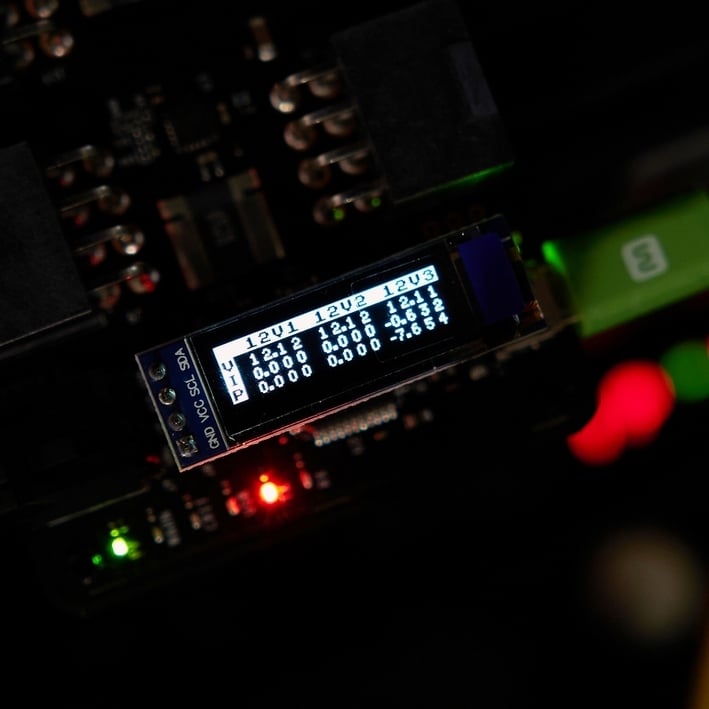
PCAT's Optional OLED Display In Action
Again, the PCAT tool presents clear, simplified data within the interface, but the detailed real-time data is captured in log files as well. Even without the software running, the optional OLED display provides actual, real-time measured power data at a glance. The OLED display automatically alternates between total power and the power being consumed by the individual rails.

FrameView Overlay During Wofenstein: Youngblood
Once installed and configured to your liking, FrameView 1.1 will present an on-screen overlay with a multitude of data – visible at the upper-right corner of the screengrab here, captured during a benchmark run with Wolfenstein: Youngblood. For quick and dirty testing of different graphics card or graphics settings, the data presented on-screen by FrameView can help users ascertain how something has affected performance, but again, deeper analysis is an option thanks to the detailed, real-time data captured in the log files.

Any number of data points can be compared and contrasted using the information that’s captured by FrameView, including quick summaries of benchmark runs from different graphics cards (in table form), bar charts, and individual full capture plots, like the ones shown above.
NVIDIA Reviewer Toolkit Summary
The NVIDIA Reviewer Toolkit gives users the ability to capture and analyze a treasure-trove of performance and power related data. We are still digesting all of the possibilities and plan to work in as much new and interesting data as we can with our future graphics and gaming covering, without bombarding you all with information overload. If there is something specific you’d like to see, please comment below and let us know.For now, the NVIDIA Reviewer Toolkit and LDAT and PCAT hardware is an early, limited-release we were lucky enough to be a part of. The FrameView 1.1 tool, however, is available for download directly from NVIDIA website if you’d like to give it a try.


