|
Seagate FireCuda 540: 2TB for $269
The speedy Seagate FireCuda 540 is a PCIe Gen 5 SSD with fast sequential transfers, which targets discerning gamers and content creators.
|
|
|
- Excellent Overall Performance
- Fast Game Level Loads
- Competitive Latency
- Latest PCIe Gen 5 Interface
|
- Requires Additional Cooling
- Price Premium Over Competition
|
|
It has been quite some time since we too a look at a Seagate drive. We built a home server using the company's then-new
12TB Barracuda Pro and IronWolf hard drives back in 2017 and we also took a look at the
Momentus XT hybrid drive years ago, but today we're goign to look at an enthusiast-class, high-performance SSD, the FireCuda 540. Seagate's been shipping solid-state storage since 2009, and its previous-generation FireCuda 530 was widely-recognized as one of the faster PCIe 4.0 SSDs around.
So what's new with the FireCuda 540? Well, a move to Phison's latest-and-greatest SSD controller, for starters. That's the E26, in case you don't follow storage controllers obsessively like some of us. Naturally, that brings PCIe 5.0 support to the FireCuda line, but this drive also moves from Micron's 176-layer TLC flash memory to the newer 232-layer flash. The increase in density means that this high-end PCIe SSD is not available in sizes smaller than 1TB, but it still tops out at 4TB.
Let's have a look at the specifications before we admire the drive itself...
Seagate FireCuda 540 SSD Specifications And Features
 Find The Seagate FireCuda 540 PCIe 5 SSD @ Amazon
There's a lot to take in here. We're reviewing the 2TB model of the drive, which offers approximately 10,000 MB/second—that's 10 gigabytes per second—of sequential performance. While not class-leading, that's still pretty darn fast. The random numbers are nothing to sneeze at either, although please note Seagate's use of a somewhat-unrealistic benchmark using eight CPU threads and a 32-deep I/O queue. Of course, basically every storage company does this, so we can hardly fault Seagate.
Other details of particular note in this table include the massive 2000 TBW endurance rating and the inclusion of three years of data recovery service, as well as a five-year limited warranty. The data recovery service warranty is exactly what it sounds like: if your drive dies due to manufacturing defect in the first three years, Seagate will try to help you recover the data off of it. This is a great service, and frankly, if the drive is going to spontaneously up and die on you, it's probably going to happen in the first three years.
The drive itself is a fairly unremarkable-looking gumstick SSD. However, you'll note that there's no heatsink on this drive. That's
not because it doesn't need one—this is a Phison E26-based platform, after all—but rather, because Seagate doesn't want to waste money on something you're probably not going to use anyway. The company figures that most users are going to stick the drive under a motherboard's cooling plate or even an active cooler, so the drive comes bare aside from stickers on both sides.
Note that while the FireCuda 530 was one of Sony's top recommended drives for the PlayStation 5's M.2 expansion slot, the FireCuda 540 is slightly less suited to such usage as it does require cooling of some sort, and the PS5 provides almost no cooling for its expansion bay. You'd probably want to get something like that
Graugear M.2 cooler we reported on before, as the PS5 doesn't really have a lot of room inside for the kind of M.2 coolers they sell for desktop PCs.
The packaging for the box is pretty cool, with a stylish red-and-black color scheme and a sticker indicating the salient points of the SSD: its capacity, its sequential speed, and the fact that it comes with a data recovery warranty. We're not sure if the dragon creature on the box is the fabled FireCuda, but the "Cuda" part comes from "Barracuda," which is a fish, so maybe we should just stop thinking about it.
Like many other SSDs in its class, the FireCuda 540 implements an SLC-like cache to enhance write performance. As you can see above, with the 2TB drive, that cache will operate at full speed until 500GB of data is sequentially written to the drive, at which point write performance dips considerably, but still remains over 3GB/s across the entire capacity of the drive.
Seagate FireCuda 540 SSD Benchmarks
Under each test condition, the SSDs showcased here were installed as secondary volumes in our testbed, with a separate drive used for the OS and benchmark installations. Our testbed's motherboard was updated with the latest BIOS available at the time of publication and Windows 11 was fully updated. Windows Firewall, automatic updates, and screen savers were all disabled before testing, and Focus Assist was enabled to prevent any interruptions.
In all test runs, we rebooted the system, ensured all temp and prefetch data was purged, and waited several minutes for drive activity to settle and for the system to reach an idle state before invoking a test. All of the drives here have also been updated to their latest firmware as of press time. Where applicable, we would also typically use any proprietary NVMe drivers available from a given manufacturer. When not available, the drives used the Microsoft driver included with Windows 11.
HotHardware's Test System:
Processor:
Intel Core i9-13900K
Motherboard:
MSI Z790 Godlike
Video Card:
GeForce RTX 3080
Memory:
32GB Micron DDR5-6000
Storage:
ADATA XPG GAMMIX S70 Blade (OS Drive)
ADATA XPG GAMMIX S70 (2TB)
Seagate FireCuda 540 (2TB)
ADATA Legend 970 (1TB)
Samsung SSD 990 Pro (2TB)
Corsair MP700 (2TB)
Crucial T700 (2TB) |
OS:
Windows 11 Pro x64
Chipset Drivers:
Intel v10.1.19284
Benchmarks:
IOMeter 1.1
HD Tune v5.75
ATTO v4.01.01f
AS SSD
SiSoftware SANDRA
CrystalDiskMark v8.0.4c x64
Final Fantasy XIV: Endwalker
PCMark 10 Storage Bench
3DMark Storage Tests
|
IOMeter Benchmarks
IOMeter is a well-respected industry standard benchmark. However, despite our results with IOMeter scaling as expected, it is debatable as to whether or not certain access patterns actually provide a valid example of real-world performance. The access patterns we tested may not reflect your particular workloads, for example. That said, we do think IOMeter is a reliable gauge for relative throughput, latency, and bandwidth with a given storage solution. In addition, there are certain highly-strenuous workloads you can place on a drive with IOMeter that you can't with most other storage benchmark tools.
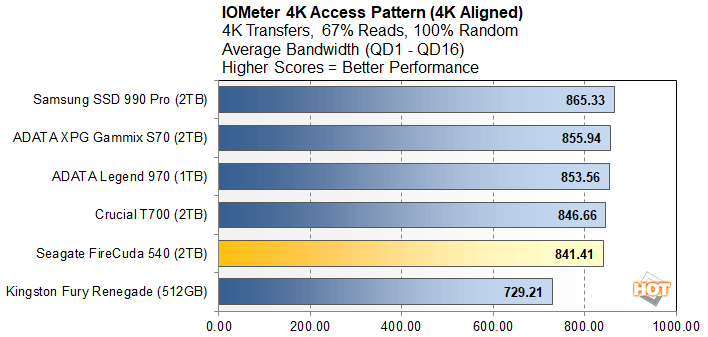
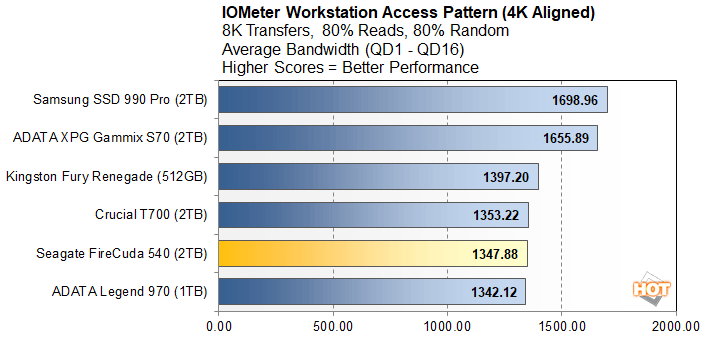
In the following tables, we're showing two sets of access patterns; a custom Workstation pattern, with an 8K transfer size, consisting of 80% reads (20% writes) and 80% random (20% sequential) access and a 4K access pattern with a 4K transfer size, comprised of 67% reads (33% writes) and 100% random access. Queue depths from 1 to 16 were tested...
We should be clear right at the start of our benchmarks here that all of these SSDs are extremely fast. These are the cream of the crop as far as consumer solid-state drives go, and being at the bottom of this list is hardly something to be ashamed of. With that said, the FireCuda 540 lands about in the middle of the stack at the lowest queue depths in these two tests with are mostly random access benchmarks. It fights for position with ADATA's new Legend 970 SSD, which we're in the process of reviewing now as well.
Again, all of these SSDs are extremely quick—the slowest drive here is doing over 75,000 IOPS in a 4K-aligned random access test with just one thread, and the other drives aren't far ahead in that test. However, once you increase the access size to 8K and start ramping up the queue depth, the faster drives start to pull away a bit.
These numbers represent the average bandwidth for the drives we tested with both access patterns, across every queue depth. In case that isn't clear enough, it's the same data as in the previous two charts, just condensed into average bandwidth of the results across all four tests -- not IOps.
Aside from the Kingston Fury Renegade, which struggles a little, all of these drives are broadly equivalent in performance with 4K random transfers. Jumping up to 8K accesses gives the Samsung SSD 990 Pro and the XPG Gammix S70 a significant lead. Notably, both of those drives are PCIe 4.0 models, helpfully illustrating that the interface really isn't the bottleneck in the most common client use cases.
Assuming nothing has gone grievously wrong, the latency tests should look like a mirror of the bandwidth tests, which is to say that they should be reversed. That's the case here, which means that there are no real surprises—the drives that offer the best random performance also offer the lowest response time and access latency, which means everything is working as expected.
SiSoft SANDRA 2022
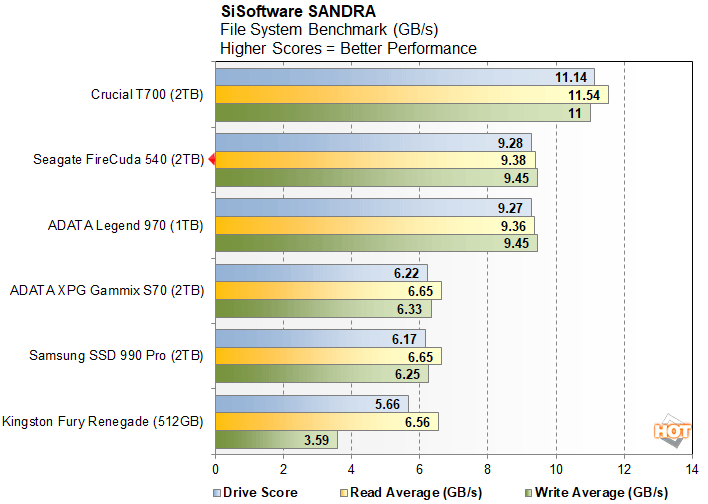
Next, we used SiSoft SANDRA, the System ANalyzer, Diagnostic and Reporting Assistant for some quick tests. Here, we used the File System Test and provide the results from our comparison SSDs. Read and write performance metrics, along with the overall drive score, are detailed below.
Sandra's storage benchmark is much more a test of sequential performance, and as you'd expect, our PCIe 5.0 drives leave the older PCIe 4.0 drives in the dust. These tests aren't super relevant to most users, but if you're doing a lot of file copying, or manipulating very large files frequently, then this might be the most important tests to you. The FireCuda 540 offers excellent performance in this test, on par with the Adata drive—naturally, as both SSDs use the same controller and PCIe 5.0 interface.
ATTO Disk Benchmark
ATTO is another "quick and dirty" type of disk benchmark that measures transfer speeds across a specific volume length. It measures raw transfer rates for both reads and writes and graphs them out in an easily interpreted chart. We chose .5KB through 64MB transfer sizes and a queue depth of 6 over a total max volume length of 256MB. ATTO's workloads are sequential in nature and measure raw bandwidth, rather than I/O response time, access latency, etc.
The write result is very impressive here, outpacing everything except the top-class Crucial T700. On the read test, the FireCuda 540 is once again neck and neck with the Crucial T700 until the critical 256KB test, although ADATA's Legend 970 is running right alongside as well.
These ATTO throughput tests are measured in IOPS, so keep that in mind as you look at the charts. Overall, the drives largely maintain the groupings we expect, with the three PCIe 5.0 drives running ahead of the pack. The Legend 970 and this FireCuda 540 largely match pace with each other, while the T700 typically leads, although the FireCuda 540 does have a curious spike at the 256K transfer size in reads.
AS SSD Compression Benchmark
Next up we ran the Compression Benchmark built-into AS SSD, an SSD specific benchmark being developed by Alex Intelligent Software. This test is interesting because it uses a mix of compressible and non-compressible data and outputs both Read and Write throughput of the drive. We only graphed a small fraction of the data (1% compressible, 50% compressible, and 100% compressible), but the trend is representative of the benchmark’s complete results.
The compressibility of the data being transferred across the drives we tested has virtually no impact on performance, but it's good to confirm that we've come a long way from the days of SandForce controllers losing two-thirds of their performance on non-compressible data.The only odd outlier is the small gain on the Adata Legend 970 on the write test. As far as the FireCuda 540 goes, its results actually went down ever so slightly as data became more compressible. Most of the variation seen here with these drives is due to their behavior with this specific benchmark's workload.