MSI Aegis RS 14th Gen Desktop Review: Well-Balanced PC Gaming
MSI Aegis RS 14th Gen Gaming PC: CPU, System And Gaming Benchmarks

We've also included data from some previous gaming PC, CPU and GPU reviews as points of reference, and also have added additional data from our internal test bench, powered by a Core i9-13900K overclocked to Core i9-14900K clock speeds, installed in an ASRock Z790 Taichi Lite paired to 32GB of G.Skill Flare X5 clocked at an effective 5,600MT/s. This test bench was used to show performance with an RTX 4090 as well as an RTX 4070, to see how the MSI Aegis RS 14th Gen faired against a similarly configured system using alternate components.
IOMeter Storage Benchmark
IOMeter is a highly customizable storage benchmark that's ideal for testing sustained write speeds. We set it up to run a 15-minute long sequential write test at a queue depth of eight and a thread count of one. Each SSD was tested with different amounts of free space / unused capacity (10%, 50%, and 90% full) to detail how write performance degrades as the SSD is filled. The speeds shown in the chart are an average across the entire test.
Even at 10% filled, the MSI M450 Spatium 2TB doesn't perform nearly as well as the other drives. At 2.5GB/s, it's far from saturating its PCIe 4.0 interface, which is capable of about 8GB/s. At 50% filled, write performance drops down to 153MB/s, which means slow sequential transfers and perhaps longer game installation times. The Aegis RS 14th Gen would have been better served by MSI's own M570 Spatium PCIe 5.0 SSD, which is between 2.5 to 4 times faster than the M450. Granted, the M570 is more expensive, but having the option at all would be nice.
CrystalDiskMark Storage Benchmark
CrystalDiskMark is a synthetic storage benchmark that essentially shows you the best-case-scenario performance for SSDs. It has many customizable parameters that can change the characteristics of the workloads it runs. For our testing we ran two workloads: a sequential one at 1MB block size at a queue depth of eight, and a random one with a 4KB block size and queue depth of 1.

In the sequential test, the M450 inside the MSI Aegis RS 14th is generally slower than the other drives, as you would expect, and it is substantially outclassed by the PC801 inside the Aurora R16. We included performance data from the M570 just as an example of what MSI has in its stable of components. Thankfully, things are brighter in the random test, and the M450 even beats the PC801 in the write benchmark.
3DMark Storage Benchmark
3DMark's Storage benchmark tests in five AAA games in a variety of different scenarios, such as saving game data, loading game levels, and installing a game. 3DMark then gives you a score that rates overall performance, which hinges on overall transfer speeds and latency.
Although the MSI Aegis RS's included M450 Spatium is once again in last place here, its performance is acceptable and not that far behind the PC801 in the Aurora R16. In the future, faster PCIe 5.0 drives that can sustain performance over the long-haul will likely become more important as DirectStorage is used in more and more games, but for now an M450 is perfectly fine.
Speedometer 2.0 Benchmark
Now we're moving into general system performance with Speedometer 2.0. This is a browser benchmark that uses JavaScript to simulate web application performance, which is going to be mostly CPU bound. We tested on Microsoft Edge with default settings.
The Aegis nearly tops the chart here with a second place finish, coming out between the 14900K-equipped Neuron and the overclocked 13900K in our test bench. Granted, a 14700KF is more than enough for web browsing, but it's good to see the MSI Aegis RS 14th stacking up nicely here.
Cinebench R23 Rendering Benchmark
Based on Maxon's Cinema 4D rendering software, Cinebench R23 renders a 3D scene using the CPU, which can be tested with all of its threads or just one. Both multi- and single-threaded performance are important considerations, and Cinebench R23 basically shows you the best case scenario in a workload that's capable of using many threads and cores.
With its power level effectively unlocked and quality AIO liquid cooler installed on the chip, the Aegis's Core i7-14700KF was almost as fast as the 14900K(F) in the Neuron and the Aurora R16 in the multi-threaded test. Of course, even with ideal cooling and power delivery, the 14700K won't be able to catch up to the 14900K, but it can come pretty close. Single-threaded performance is mostly unimpacted by peak power levels, however, so the Aegis slipped behind the Neuron and the Alienware Aurora R16 a bit here.
Blender 3D Rendering Benchmark
Blender is a 3D content creation application, which allows users to create 3D objects for use in images and animation. The official Blender benchmark shows rendering performance in three different scenes, and it can be run on both CPUs and GPUs. Up first we have performance results for rendering on the CPU.
Like we saw in Cinebench R23, the Aegis is nipping on the Aurora R16's heels. Unlike some pre-builts, MSI has given the Aegis both the cooling and power to allow its CPU to run at full bore. By contrast, the Aurora R16 has a more modest cooler and sticks with the max 253w power level for the 14900K.

Although the Aegis trails here, it's perfectly understandable given its GeForce RTX 4070 going up against a 4080 and a 4090. These results are in line with our expectations for these GPUs, so the Aegis is performing as expected here. We should mention, there are other configurations of the Aegis RS 14 that come with a GeForce RTX 4070 Ti or RTX 4080, if you'd prefer a more powerful GPU.
Geekbench v5.4.1 System Benchmark
Geekbench is another CPU benchmark, though unlike Cinebench R23 and Blender, it tests a variety of workloads. Scores for both single- and multi-threaded performance are listed below...
Again, the Aegis' 14700KF impresses here with great performance, which is nearly as good as the Aurora R16's 14900KF. It's also on par in the multi-threaded test with our Ryzen 9 7950X test bench, though the 7950X does generally consume less power and thus is more efficient.
PCMark 10 System Productivity And Content Creation Benchmark
PCMark 10 throws pretty much everything but the kitchen sink at PCs, and in the normal version there are three categories of workloads: Digital Content Creation, Essentials, and Productivity. Those scores are then averaged out to give an overall score. Although performance in PCMark 10 depends on every component to some extent, it's mostly CPU bound.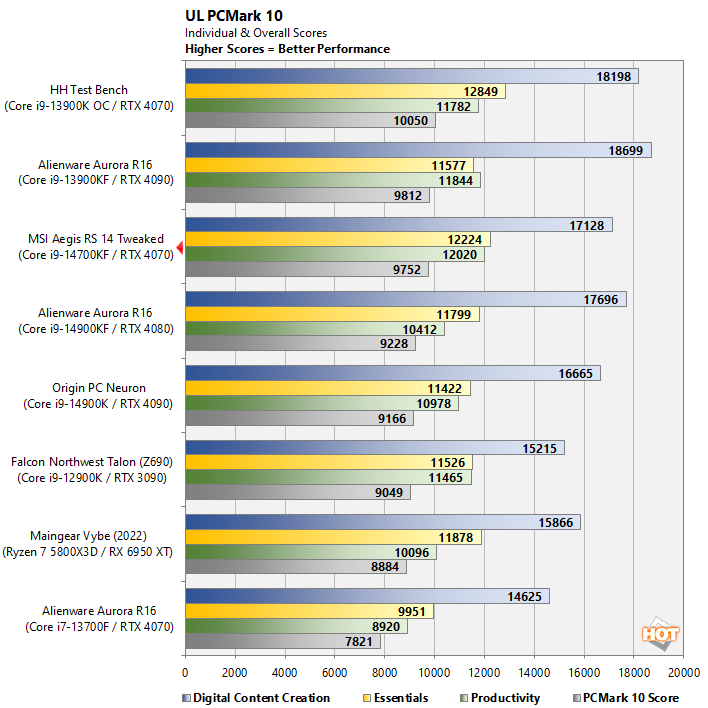
The Aegis landed in third place in PCMark 10, just behind our top-end test bench and actually ahead of two 14900K(F)-equipped PCs that also have faster GPUs. This is probably thanks to some driver and OS updates and the 14700KF inside the Aegis not being power limited, which allows the CPU to keep boosting as high as it can over the course of the benchmark.
3DMark Time Spy DirectX 12 Benchmark
Let's kick off some graphics and gaming related benchmarks with 3DMark Time Spy. Though from 2016, it's still 3DMark's latest gaming benchmark that doesn't use ray tracing. We're mostly focused on graphics performance here rather than the physics/CPU data...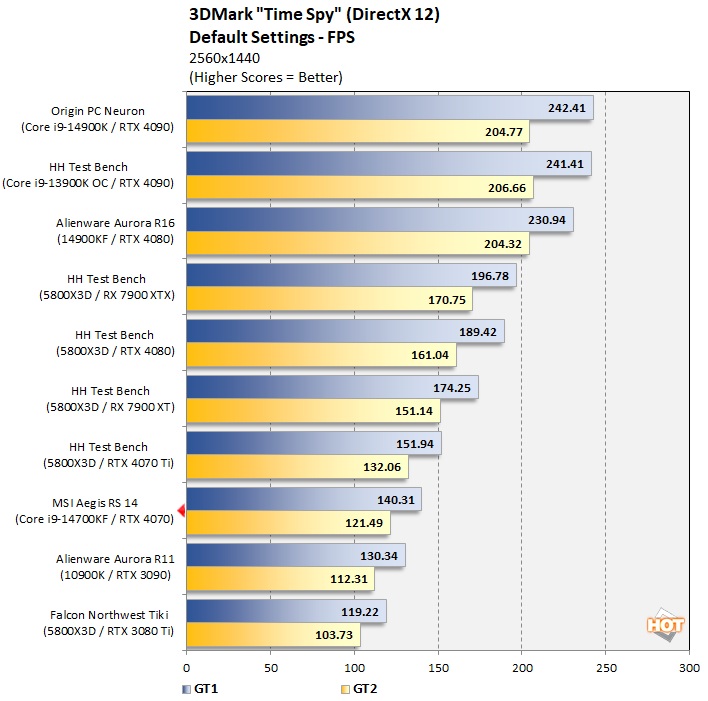

There's nothing particularly surprising with these results; the RTX 4070 in the Aegis performs as expected. You can definitely expect higher performance if you get an Aegis with an RTX 4070 Ti or 4080 instead.
Metro Exodus: Enhanced Edition Benchmark
Metro Exodus was one of the first titles to support ray tracing when it came out in 2019, and although it was ground-breaking, it has also clearly aged since. Metro Exodus: Enhanced Edition is the 2021 remaster that makes the game look more modern, We tested with maximum quality details, including ray tracing, in the in-game benchmark.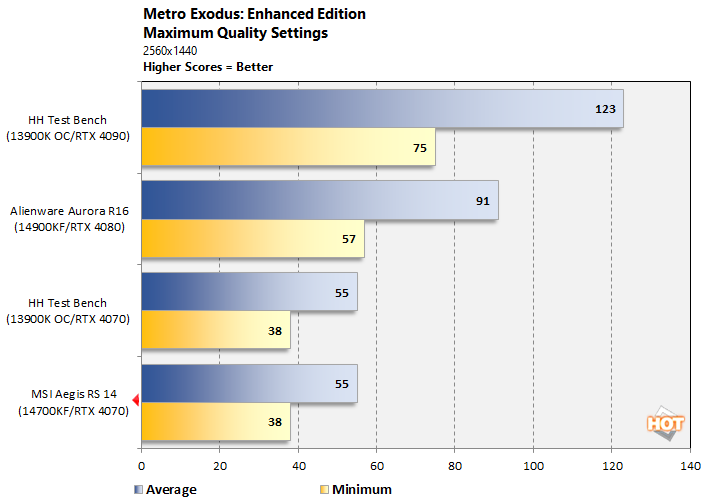
Obviously, in a completely GPU situation the GeForce RTX 4070 in the MSI Aegis RS 14th gen isn't going to catch the more powerful, more expensive GPUs. However, we can clearly see that the Aegis is squeezing all it can of its GPU, considering it and the test bench with the overclocked 13900K got the same framerate.
Total War: Three Kingdoms Benchmark
Total War: Three Kingdoms is the most recent full-sized entry in the historical Total War franchise. It's a little old as it came out in 2019, but it's still taxing on both CPUs and GPUs. We tested using the in-game benchmark battle at maximum quality settings, including maximum unit sizes.
Again, things are pretty similar to Metro Exodus: Enhanced Edition -- there's nearly no difference between the Aegis and the test bench, when both are outfitted with the GeForce RTX 4070. The average framerate is a little low with these settings, though the 99th percentile framerate is actually quite good compared to the Aurora R16.
Hitman 3 Benchmark
Hitman 3 is the final entry in the modern Hitman trilogy, and while it's a challenge for graphics cards, it's quite CPU intensive too thanks to the many NPCs and partially destructible environments in each level. We tested at maximum quality settings and enabled the DLSS balanced setting in order to get a happy medium between 1440p and 1080p. We used the built-in benchmark and set the level to Dartmoor.
For the first time, we can actually see a difference between the test bench and the Aegis, which was a little slower overall. However, the test bench was only around 5% to 10% faster, which isn't very noticeable, and 84 FPS is a pretty respectable framerate given there's literally nothing else left to enable in this game to boost the image quality.
The Witcher 3: Wild Hunt Benchmark
The Witcher 3: Wild Hunt is perhaps 2015's most celebrated game, and in 2022 it received a remaster. The game now runs on DirectX 12 and has ray tracing, DLSS, and higher quality graphics settings. We tested using real gameplay as there is no built-in benchmark, and conducted our tests in the Novigrad level, which is especially CPU intensive due to all the NPCs. We set every option to the max, but disabled ray tracing, Hairworks, and blur.
There's a small difference between the Aegis and the test bench, which was around 5% to 10% faster. Just like in Hitman 3, this is probably down to the overclocked 13900K, which can hit higher clock speeds than the 14700KF in the Aegis. Still, 76 FPS with these settings is nothing to sneeze at.
Counter-Strike 2 Benchmark
Counter-Strike 2 is the long anticipated sequel to Counter-Strike: Global Offensive, which it supplented in 2023. Like other competitive games, Counter-Strike 2 is meant to be run at a significantly high framerates, and although we've selected maximum graphics settings, you'll see that there are more than enough frames to go around. Since there is no built-in benchmark, we used the training session tutorial for our tests.
Here we see the MSI Aegis RS 14th Gen pulling ahead of our test bench slightly in terms of average framerates, but offering a slightly slower minimum. Keep in mind, however, testing a game like Counter-Strike 2 has a lot of variability and noise, so we'd call this one effectively a tie between the MSI machine and our RTX 4070-powered test bed.


