HP Z8 Fury G5 Workstation Review: Xeon W & Quad RTX A6000 Power
HP Z8 Fury G5 Workstation: System And Pro-Vis Graphics Benchmarks

ATTO Disk Benchmark
The ATTO disk benchmark is a quick and simple test which measures read/write bandwidth and IOPS across a range of different data sizes. While we don't typically compare these results across multiple machines, it's useful to gauge whether a particular system's storage subsystem can handle being put under pressure.
This system is equipped with two 1TB Samsung PM9A1 drives, with one devoted to the operating system and the other available for bulk data. Both drives perform virtually identically, so we are only reporting the system drive’s results here. Performance is strong for a PCIe Gen 4 option, though not exactly record breaking. Peak reads are around 6.3GB/s and peak writes are around 4.8GB/s for both drives. We should note that these results can also vary significantly depending on drive arrangements, RAID setups, and other factors.
Cinebench R23 Performance
Cinebench rendering performance test based on Cinema 4D from Maxon. Cinema 4D is a 3D rendering and animation tool suite used by animation houses and producers like Sony Animation and many others. It's very demanding of system processor resources and can utilize up to 256 threads, which makes it an excellent gauge of computational throughput. This is a multi-threaded, multi-processor aware benchmark that renders and animates 3D scenes and tracks the length of the entire process. The rate at which each test system was able to render the entire scene is represented in the graphs below.
In a heavily threaded workload, the 56-core Intel Xeon w9-3495X is outpaced by the 64-core AMD Threadripper PRO 5995WX by a comfortable margin. The deficit is a little more than the core count difference as well. Linearly scaling the Xeon w9’s result to 64 cores would only get to a score of 69,160.
Intriguingly then, the Xeon w9-3495X does deliver noticeably more performant single-thread scores. It is likely that the Xeon w9 will fare better in scenarios with lighter thread utilization where it can maintain higher clockspeeds, but exactly where the crossover point occurs is beyond the scope of this review and likely varies with different workloads anyhow.
Lame XP Audio Encoding
For this test, we created 16-copies of our own 223MB WAV file (an 11 minute Grateful Dead jam) and converted it to the MP3 format using the multi-thread capable LAME XP tool. Processing times are recorded below, listed in minutes:seconds. Shorter times equate to better performance.
Lame XP inverts the performance hierarchy, if only by a hair. Lame XP traditionally favors Intel’s architecture, so this showing is none too surprising.
7-Zip Data Decompression
The 7-Zip benchmark measures decompression performance using the LZMA method, which leverages the Lempel–Ziv–Markov chain algorithm to perform lossless data compression. The benchmark produces a final rating in GIPS (giga instructions per second).
This result tips the scales significantly back in favor of AMD. This aligns with what we saw in our Intel Sapphire Rapids review on the server side, granted EPYC 9004 series’ Genoa Zen 4 architecture is a generation newer than the Zen 3 cores found in this Threadripper PRO chip. Also keep in mind that those are dual socket servers running Linux, and shouldn’t be directly compared to these Windows workstation figures.
POV-Ray CPU Ray Tracing Benchmark
POV-Ray, or the Persistence of Vision Ray-Tracer, is an open source tool for creating realistically lit images. We tested with POV-Ray's standard 'one-CPU' and 'all-CPU' benchmarking tools on all of our test machines and recorded the scores reported for each. Results are measured in pixels-per-second throughput; higher scores equate to better performance.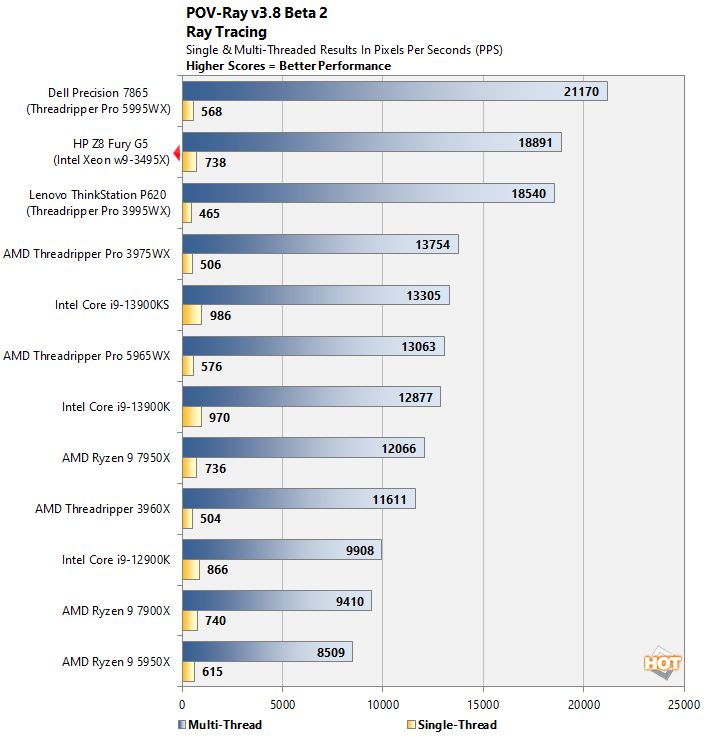
The Xeon w9 performs more reasonably in POV-Ray, about in line with the Cinebench result above. Once again, its single-threaded performance outstrips everything else in the workstation landscape. Only hot-clocked desktop CPU parts fare better in that regard.
Y-Cruncher Multi-Threaded Pi Benchmark
Y-Cruncher is a multi-core-capable tool that calculates the value of pi to a specified number of digits. In this case, we ran the tool on all threads and had the application calculate the value of pi to 1 billion digits. The values below are the time required to perform the calculation expressed in seconds. As a result, lower values indicate better performance.
Lest you think the Lame XP result was a fluke, the Xeon w9-3495X swoops in for another victory here. The result is hardly close this round, either, as the HP Z8 Fury G5 marks a 29% reduction in compute time.
UL 3DMark CPU Physics Benchmark
For the 3DMark Physics test, we simply create a custom 3DMark run consisting solely of the physics test, which is multi-threaded and CPU dependent, and report the results.
This CPU physics test stresses processors differently from the above tests. Multi-core performance helps to a point, but it does not scale enough to leverage the massive core counts these chips have on offer. Instead, it represents more of an in-between scenario where core frequencies and responsiveness have a greater impact. In that regard, the Xeon w9-3495X performs quite well given its weighty thread-count.
BlackMagic RAW Video Encoding Speed
The Blackmagic RAW Speed Test is a CPU and GPU benchmarking tool that tests full-resolution Blackmagic RAW video decode performance. The tool can be used to evaluate the performance at various resolutions and bitrates on the CPU or using OpenCL on a GPU. We're reporting two results here, both using 8K resolution, but at differing bitrates and compression levels.
The HP Z8 Fury G5 is off to a great start here, stealing the crown from the already-fast Dell Precision 7865. As we established in that review, memory bandwidth can be a significant factor when processing 8K raw footage, so the Xeon w9 chip is likely buoyed a bit by its DDR5 support.

This is where results just get bonkers. This may well be the most obscenely skewed performance graph we have published to date. To put this in context, we were already enamored with the 8K 3:1 performance shown by the Dell Precision 7865, noting how it showed the benefits of alleviating memory bandwidth bottlenecks to perform well-beyond our reference consumer GPU systems. The HP Z8 Fury G5 nearly doubles (1.7x) its performance. In fact, we suspect that the HP system is running up against the new 8-channel DDR5 memory bandwidth bottleneck here.
The 8K 12:1 workload is less memory constrained and scales nearly linearly by 3.6x over the Dell Precision system’s single RTX A6000 as a result. It feels like a violation of physics, but the math does check out. A dual RTX A6000 system may prove a better balance for super-clean 8K 3:1 footage, but the more common 8K 12:1 compression ratio can soar here. The HP Z8 Fury G5 is the uncompromising king of mammoth-scale video production.
Blender Rendering Benchmarks
Blender is a free and open-source 3D creation suite that can handle everything from modeling, rigging, and animation to simulation, rendering, compositing and motion tracking. It has a purpose-built benchmarking tool that will track the time it takes to complete rendering a particular model (or models). We used both the CPU and GPU focused benchmarks with all three models currently available in the benchmark tool.
This result comes with a couple asterisks. At the time of testing, the Blender Benchmark tool would no longer run v3.2.1 for us, presenting a JSON error each time. Instead, the HP Z8 Fury G5 result (and that result only) is run using v3.3.0. Version to version results should be close, but take them with a grain of salt nonetheless. We will note that v3.5.0 gives us slightly lower results yielding 453, 291, and 215 samples per minute respectively.
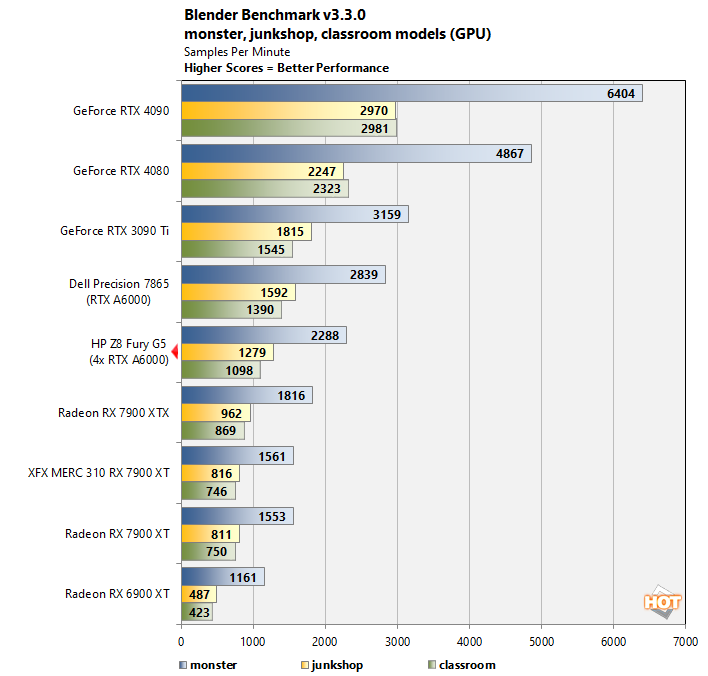
Scores for our HP Z8 Fury G5 are surprisingly low in the GPU test. Afterall, Blender can support multiple GPUs, yet the scores are lower than the Dell Precision 7865 – so what is going on? As it turns out, the Blender Benchmark Tool is strictly limited to a single graphics card, though that may not prevent render workloads from splitting between installed cards anyway and incurring performance penalties.

To explore scaling another way, we decided to download a few demo files and run them within a full Blender installation. We only ran Cycles engine scenes here as the EEVEE renderer does not support multiple GPUs either. We wish we still had the Dell Precision 7865 system in-house to compare with, but such is the nature of reviews – we can’t keep everything indefinitely.
These results show off pretty-good scaling as more cards are enabled in the system. Relative to a single GPU, we should expect two GPUs to complete the workloads in half the time, three GPUs in a third the time, and four GPUs in a quarter the time. There is some test overhead as the renders are dispatched out, but the scaling still holds mostly-true.
From a bang-for-the-buck perspective, a 3x GPU configuration is probably the best place to be. Still, many production studios will value the time savings far more than the raw cost of the system and the fourth RTX A6000 still moves the needle in the right direction.
PCMark 10 Full System Performance
Next up we have some full system testing with PCMark. We're reporting all test results from the PCMark 10 benchmark suite, including the Essentials, Productivity, Digital Content Creation and total PCMark score. The Essentials test covers workloads like web browsing, video conferencing and app start-up times, while Productivity tests everyday office apps from spreadsheets to word processing. Finally, the Digital Content Creation test evaluates performance of a machine with respect to photo and video editing, as well as rendering and visualization.
We debated whether or not to include PCMark 10 in our roundup for the same reasons we discussed in our Dell Precision 7865 review. Nevertheless it is valuable to see that raw horsepower doesn’t necessarily translate to a superior user experience with more mundane productivity workloads. Bigger silicon is less responsive to tasks like web browsing or sorting spreadsheets, though we can’t say it will really detract, either.
SPECviewperf 2020 v3 OpenGL / DX Benchmarks
SPECviewperf includes a variety of tests, which produce significantly different framerates, so we've sorted them into three groups to make the results a bit easier to sort through. Please note the legends at the bottom of each chart, which designate the application or viewset used…


Unfortunately, SPECviewperf is another benchmark that is incapable of leveraging multiple GPUs. As a result, we see a similar situation to the Blender Benchmark tool where the HP Z8 Fury G5 narrowly trails the leaner Dell Precision 7865 system in nearly every test.


