PowerColor Red Devil Ultimate Radeon RX 6900 XT Review: Speed Demon
PowerColor Red Devil Ultimate Radeon RX 6900 XT: Unigine, UL And VR Benchmarks
How We Configured Our Test Systems: We tested the graphics cards represented in this article on a MSI X570 Godlike motherboard, equipped with a Ryzen 9 5950X and 16GB of G.SKILL DDR4 RAM clocked at 3,200MHz. The first thing we did when configuring the test system was enter the UEFI and set all values to their "high performance" defaults, then we disabled any integrated peripherals that wouldn't be put to use. The memory's clock was dialed in to its optimal performance settings using its XMP profile and the solid state drive was then formatted and Windows 10 Professional x64 was installed and fully updated. When the Windows installation was complete, we installed all of the drivers, games, applications and benchmark tools necessary to complete our tests.
For all of the standard tests, the Radeon RX 6000 series cards were tested using their "Balanced" performance profile enabled in the driver, but the PowerColor card was tested in its default OC mode (versus the optional Silent mode). "Rage" mode was enabled on the PowerColor Red Devil Ultimate Radeon RX 6900 XT for a sampling of tests present in the overclocking section of this article, however. The Radeons were also tested with Smart Access Memory enabled throughout.

|
|
|
| Hardware Used: AMD Ryzen 9 5950X (3.4GHz - 4.9GHz, 16-Core) MSI X570 Godlike (AMD X570 Chipset) 16GB G.SKILL DDR4-3200 Samsung SSD 970 EVO Integrated Audio Integrated Network NVIDIA GeForce RTX 3090 FE NVIDIA GeForce RTX 3080 FE NVIDIA GeForce RTX 2080 Ti FE AMD Radeon RX 6800 AMD Radeon RX 6800 XT AMD Radeon RX 6900 XT PowerColor Red Devil Ultimate Radeon RX 6900 XT |
Relevant Software: Windows 10 Pro x64 (v2004) AMD Radeon Software v21.3.2 NVIDIA GeForce Drivers v457.30 Benchmarks Used: VRMark 3DMark (Time Spy, Fire Strike, Port Royal, DXR) Unigine Superposition Crytek Neon Noir Metro Exodus Red Dead Redemption 2 Gears Tactics F1 2020 FarCry: New Dawn |
|
|
|

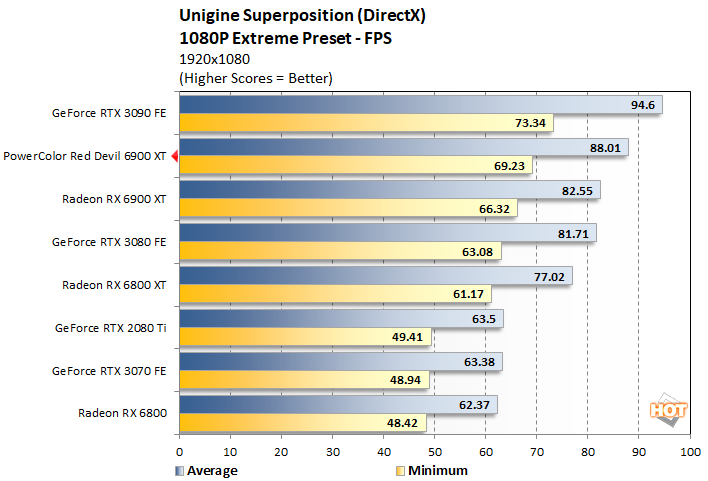
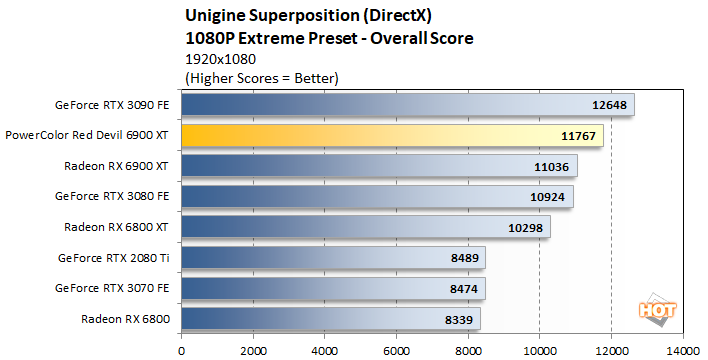
Unigine Superposition
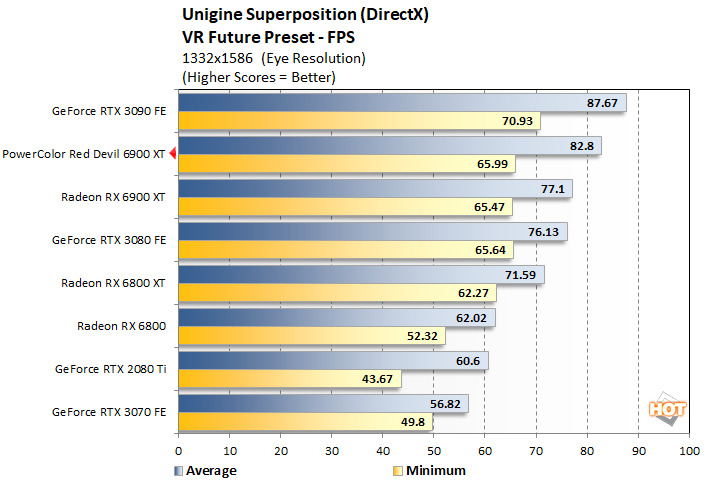
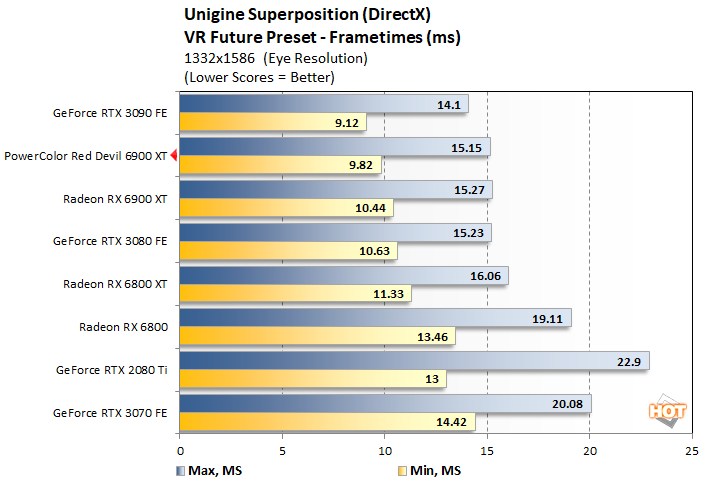
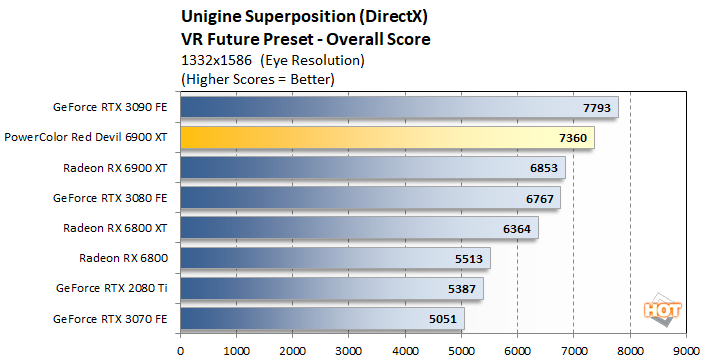
Superposition's VR Future benchmark tells essentially the same story, with the PowerColor Red Devil Ultimate Radeon RX 6900 XT easily outrunning the AMD's reference design, but trailing the GeForce RTX 3090 slightly.
|

Futuremark VRMark

PowerColor Red Devil Ultimate Radeon RX 6900 XT VRMark Details
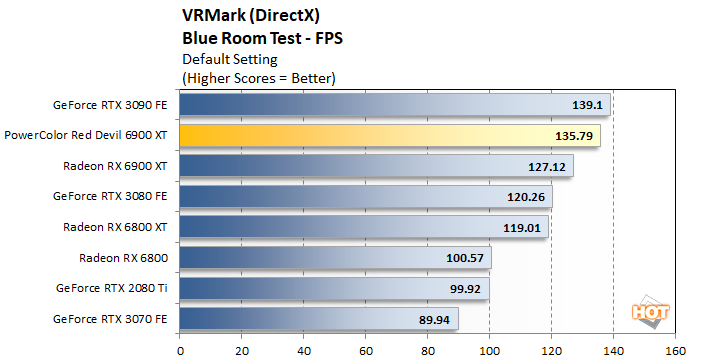
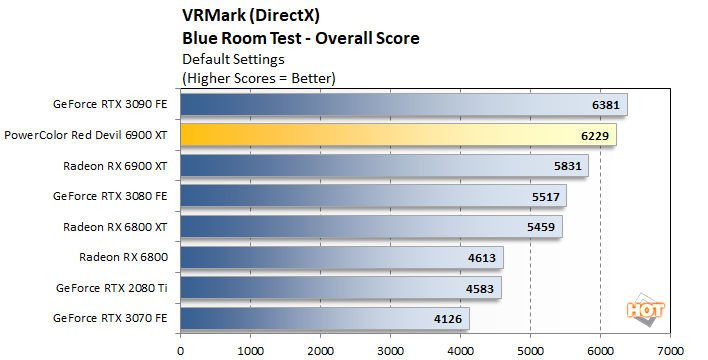
Our results with VRMark show the PowerColor Red Devil Ultimate Radeon RX 6900 XT nearly catching the GeForce RTX 3090 and finishing about 400 points head of the reference Radeon RX 6900 XT.
|


PowerColor Red Devil Ultimate Radeon RX 6900 XT Time Spy Details
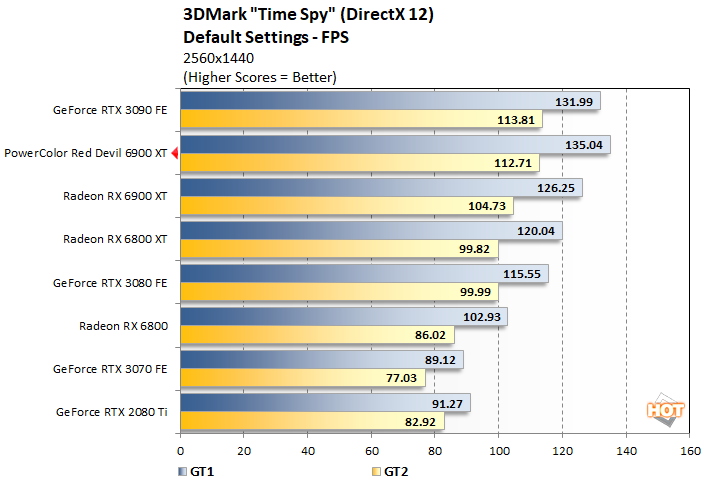
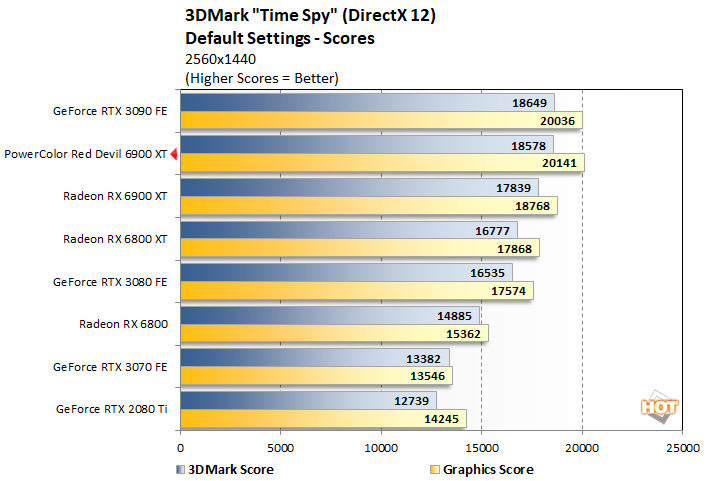
|
|
|
3DMark Fire Strike

PowerColor Red Devil Ultimate Radeon RX 6900 XT Fire Strike Details
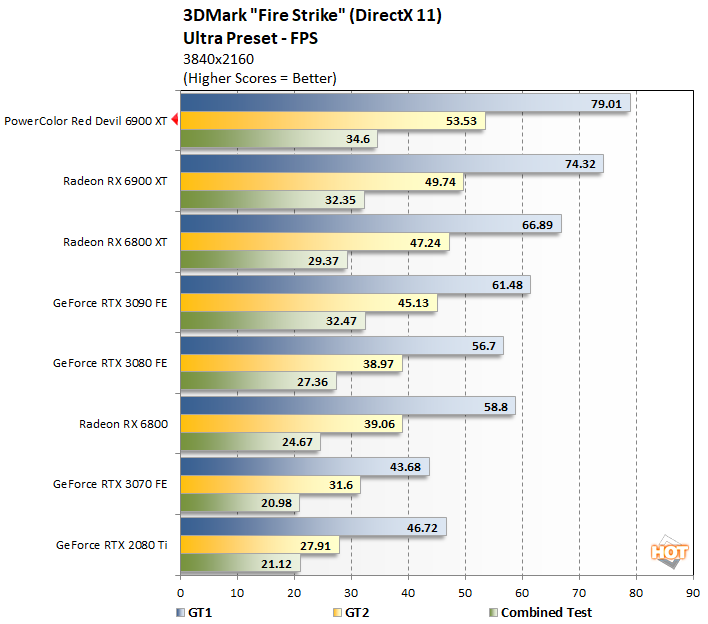
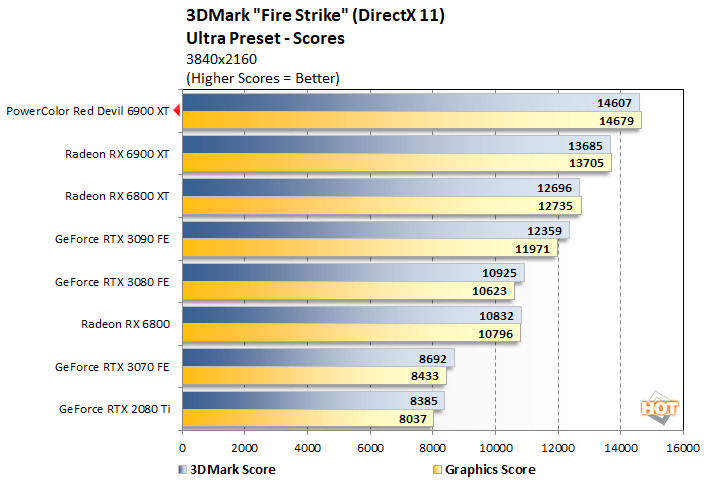
The PowerColor Red Devil Ultimate Radeon RX 6900 XT lands in the pole position in Fire Strike and puts up the best score we have seen from a single GPU in this test to date.
|

3DMark Port Royal

PowerColor Red Devil Ultimate Radeon RX 6900 XT Port Royal Details
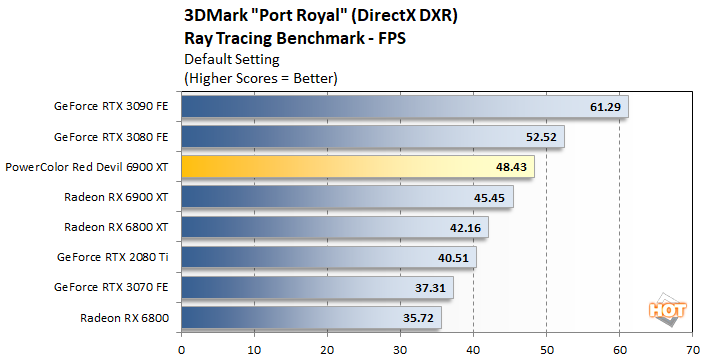
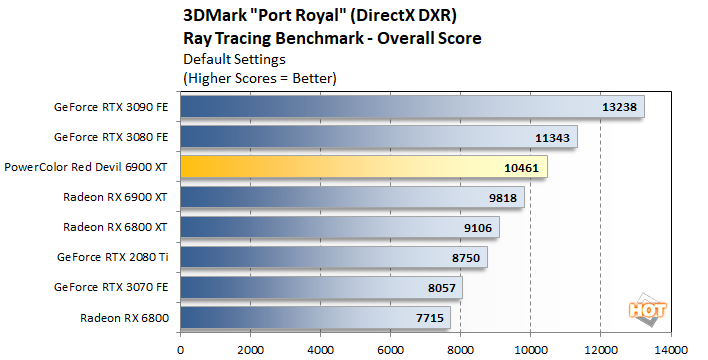
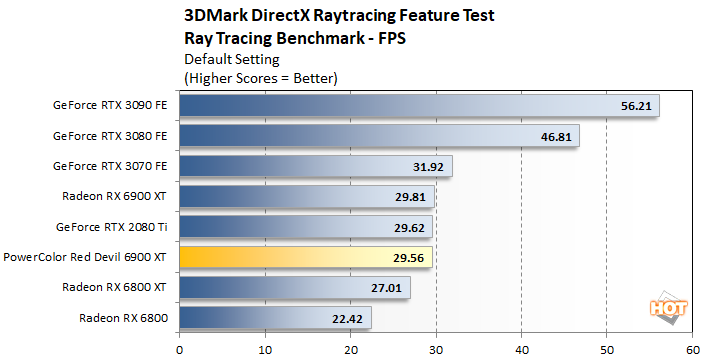
We also experimented with the more focused DirectX Ray Tracing Feature test, which was recently released as an update to 3DMark...

PowerColor Red Devil Ultimate Radeon RX 6900 XT DXR Feature Test Details