How We Configured Our Test Systems: We tested the graphics cards represented in this article on an ASUS Prime X299 Deluxe motherboard powered by a Core i9-10980XE 18-core / 36-thread processor and 32GB of HyperX DDR4 RAM clocked at 2,933MHz. The first thing we did when configuring the test system was enter the UEFI and set all values to their "high performance" defaults, then we disabled any integrated peripherals that wouldn't be put to use. The memory's clock was dialed in to its optimal performance settings using its XMP profile and the solid state drive was then formatted and Windows 10 Professional x64 was installed and fully updated. When the Windows installation was complete, we installed all of the drivers, games, applications and benchmark tools necessary to complete our tests.
|

|
| HotHardware's Test System |
| Intel Core i9 Powered |
|
Hardware Used:
Intel Core i9-10980XE
(3GHz - 4.4GHz, 18-Core)
ASUS X299 Prime
(Intel X299 Chipset)
32GB Corsair DDR4-2933
Samsung SSD 970 EVO
Integrated Audio
Integrated Network
NVIDIA GeForce RTX 3080 FE
NVIDIA Titan RTX
NVIDIA GeForce RTX 2080 Ti FE
NVIDIA GeForce RTX 2080 Super
AMD Radeon RX 5700 XT
AMD Radeon RX 5600 XT
|
Relevant Software:
Windows 10 Pro x64 (v2004)
AMD Radeon Software v20.8.3
NVIDIA GeForce Drivers v456.16
Benchmarks Used:
IndigoBench v4
LuxMark v4_alpha0
SiSoft SANDRA 2020
VRMark
3DMark (Time Spy, Fire Strike, Port Royal)
Unigine Superposition
Crytek Neon Noir
Metro Exodus
Red Dead Redemption 2
Gears Tactics
Wolfenstein: Youngblood
FarCry: New Dawn |
|
|
| SiSoft SANDRA 2020 |
| Cryptography And Image Processing OpenCL Performance Tests |
|
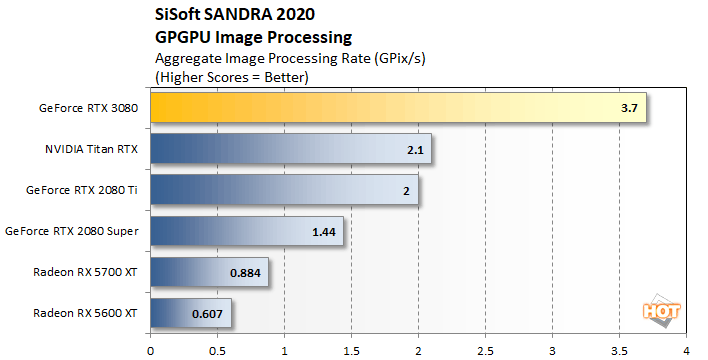
SANDRA's GPGPU Image Processing benchmark runs through an array of filters on its reference data and offers up an aggregate score, derived from a number of individual results. CUDA and OpenCL code paths are available in these tests, but we used OpenCL on all cards to keep the playing field level. Previously, using the
CUDA path with NVIDIA GPUs resulted in better performance, but OpenCL actually outperforms CUDA in these tests now...
The Ampere-based GeForce RTX 3080 absolutely crushes every other card we tested here. It offers approximately 2.6X the performance of a GeForce RTX 2080 Super and outpaces the mighty Titan RTX by about 76%.
|
|
LuxMark v4.0_alpha0 |
|
OpenCL Benchmark |
|
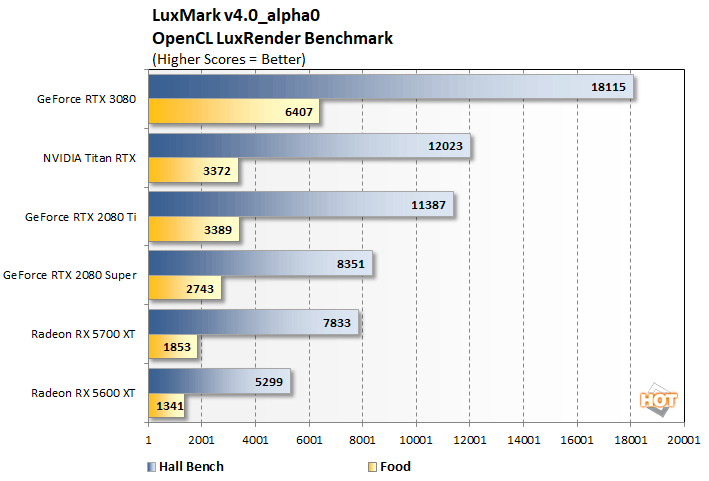
LuxMark is a cross-platform, OpenCL-accelerated 3D rendering benchmark. It's a tool based on the open source LuxRender physically-based spectral rendering engine, which accurately models the transportation of light and supports high dynamic range. LuxRender features a number of material types to allow rendering of photo-realistic and artistic scenes. LuxRender is free software, licensed under the GPL, that offers plugins for packages like Blender, Maya, Cinema 4D and 3DS Max.
Once again we see the GeForce RTX 3080 significantly outpacing all of the other cards. NVIDIA's GeForce RTX 3080 more than doubles the performance of the RTX 2080 Super and leaves the Titan RTX in its wake. The Radeons finish way behind and land at the bottom of the charts.
|
|
IndigoBench |
|
GPU Rendering Performance |
|
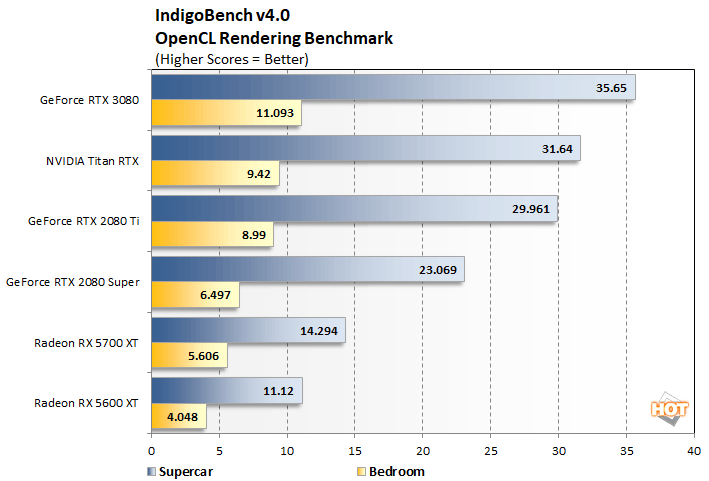
IndigoBench is based on Indigo 4's advanced rendering engine and offers both CPU and GPU rendering modes for its two built-in models. The standalone benchmark is available for Windows, MacOS, and Linux and outputs results in M/Samples per second.
The deltas separating the GeForce RTX 3080 from the other cards are smaller in IndigoBench, but the card still manages to blow past the Titan RTX and more than double the performance of AMD's current flagship Radeon GPU.
|
|
| Unigine Superposition |
| Pseudo-DirectX / OpenGL Gaming |
|
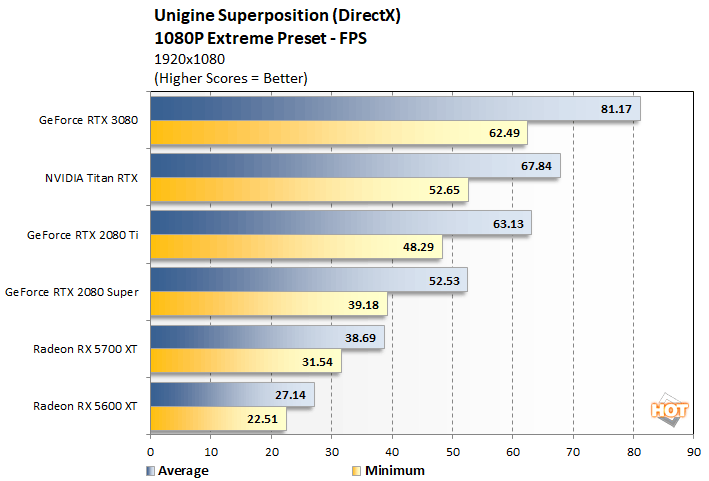
Superposition is a relatively new
benchmark from Unigine, powered by the UNIGINE 2 Engine. It offers an array of benchmark modes, targeting gaming workloads as well as
VR, with both DirectX and OpenGL code paths. There is an extreme hardware stability test built-in as well. Unigine Superposition uses the developer’s unique SSRTGI (Screen-Space Ray-Traced Global Illumination) dynamic lighting technology, along with high quality textures and models, to produce some stunning visuals. We ran Superposition in two modes using the DirectX code path – 1080p Extreme and VR Future -- to compare the performance of all of the graphics cards featured here.
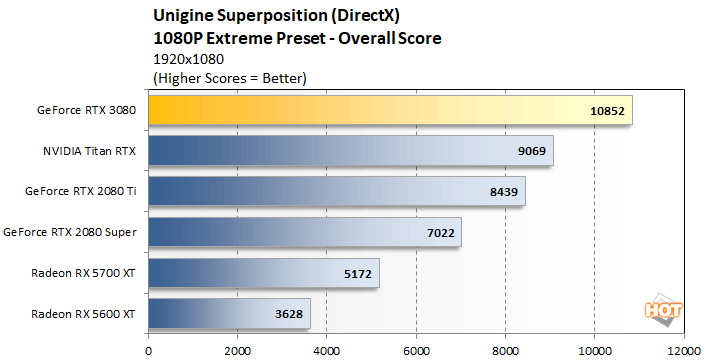
Unigine Superposition
Unigine Superposition's 1080P Extreme test puts the Ampere-based GeForce RTX 3080 more than 54% ahead of the GeForce RTX 2080 Super, and well out in front of the RTX 2080 Ti or Titan RTX. Again, AMD's fastest Radeon offers less than the half the performance here.
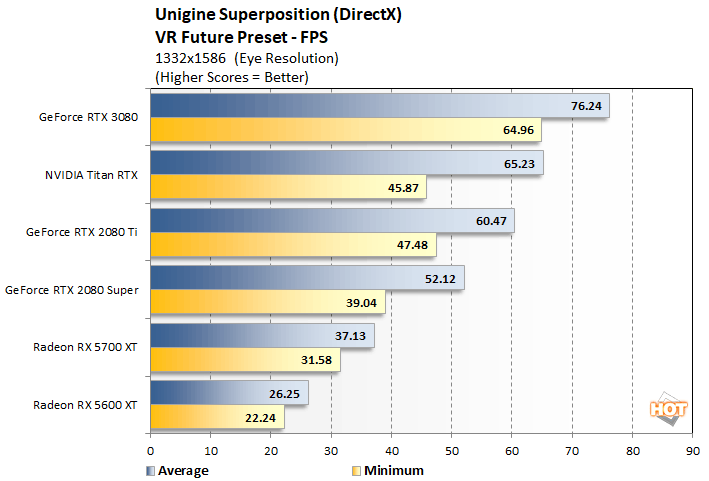
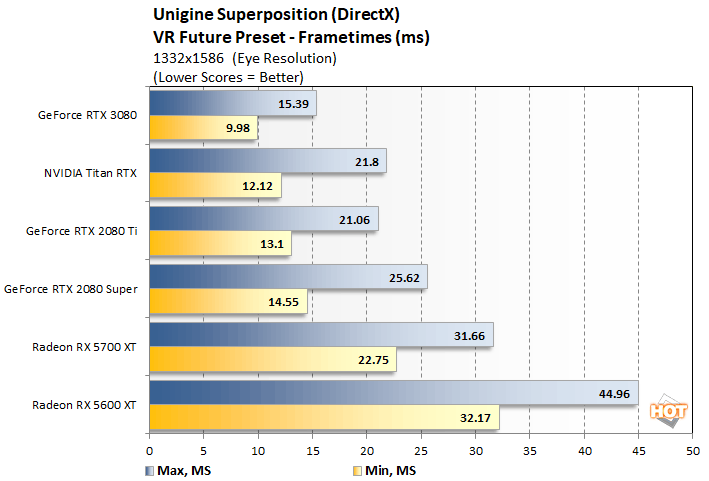
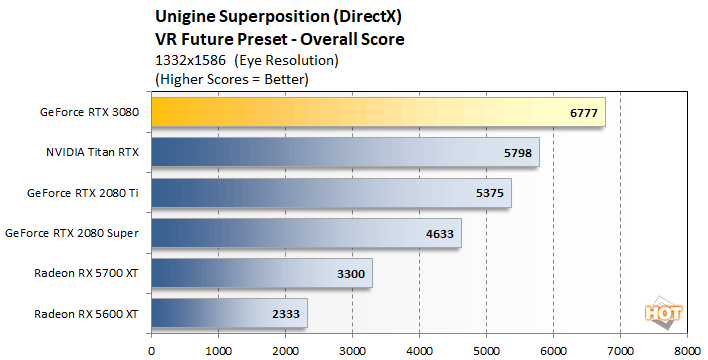
Superposition's
VR Future test tells essentially the same story -- the GeForce RTX 3080 can't be touched by any current-generation GPU. Nothing from AMD comes close and the powerful Titan RTX lags behind by nearly 18%.
|
| UL VRMark |
|
Testing Rift And Vive Readiness |
|
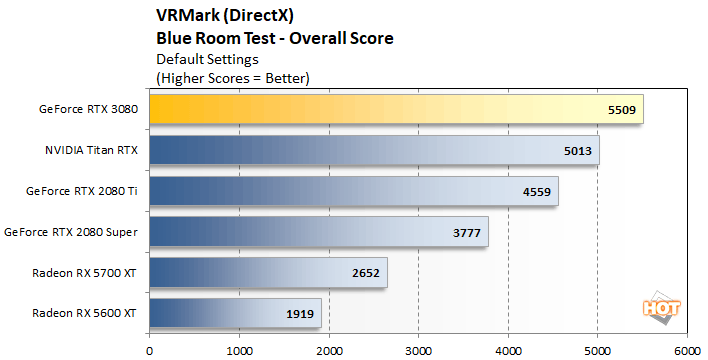
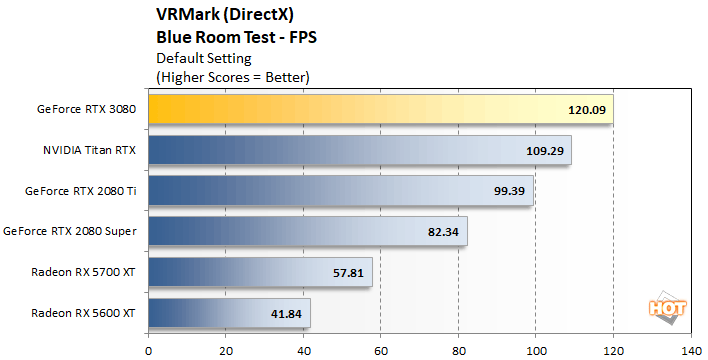
UL's VRMark is designed to test a PC’s readiness for the
HTC Vive and
Oculus Rift virtual reality headsets. The benchmark does not, however, require that one of the headsets is attached to the PC to run and it uses an in-house graphics engine and content to ensure comparable results between different platforms. We ran the "Blue Room" VRMark test at defaults settings here, which is currently the most taxing test offered by the tool.
Futuremark VRMark
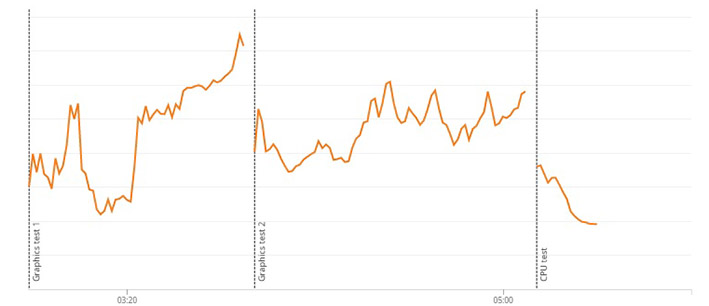
GeForce RTX 3080 VRMark Details
In VR Mark, once again, we find the new GeForce RTX 3080 leading the pack by a significant margin, outrunning the GeForce RTX 2080 Super by approximately 50% and more than doubling the performance of the Navi-based Radeon RX 5700 XT.
|
| UL 3DMark Time Spy |
|
Direct X 12 Performance |
|
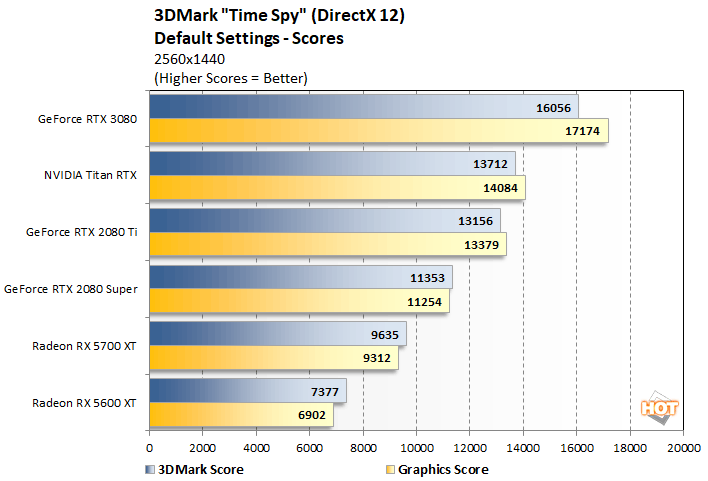
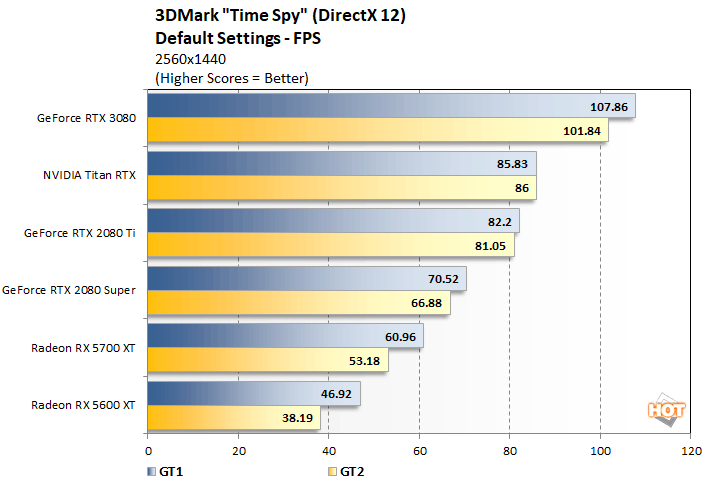
3DMark Time Spy is a synthetic DirectX benchmark test from Futuremark. It features a DirectX 12 engine built from the ground up to support bleeding-edge features like asynchronous compute, explicit multi-adapter, and multithreading. Time Spy is designed to test the
DirectX 12performance of the latest graphics cards using a variety of techniques and varied visual sequences. This benchmark was developed with input from AMD, Intel, Microsoft, NVIDIA, and the other members of the Futuremark Benchmark Development Program, to showcase the performance and visual potential of graphics cards and other system resources driven by close-to-the-metal, low-overhead APIs.
3DMark Time Spy
GeForce RTX 3080 Time Spy Details
In the
DX12-based 3DMark Tme Spy benchmark, the Ampere-powered GeForce RTX 3080 clearly leads the pack once again, blowing past the Titan RTX to finish well out in front of every other card we tested.
|
|
| UL 3DMark Fire Strike |
| Synthetic DirectX Gaming |
|
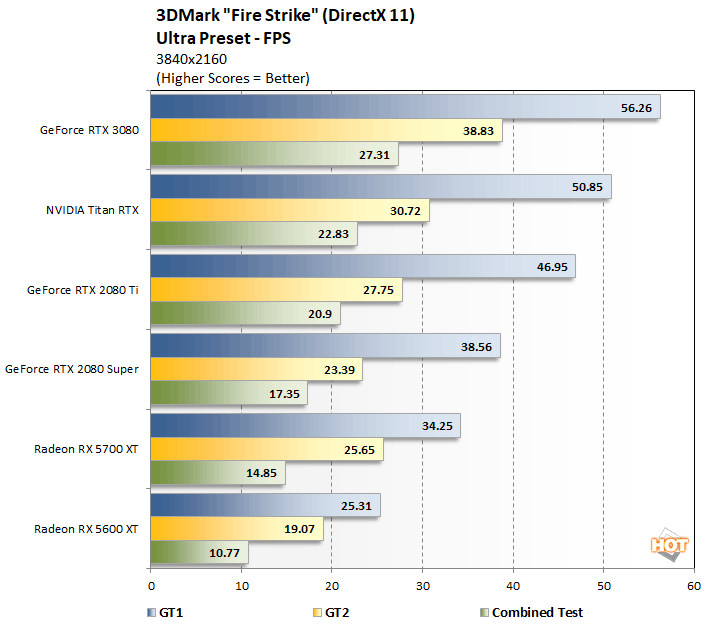
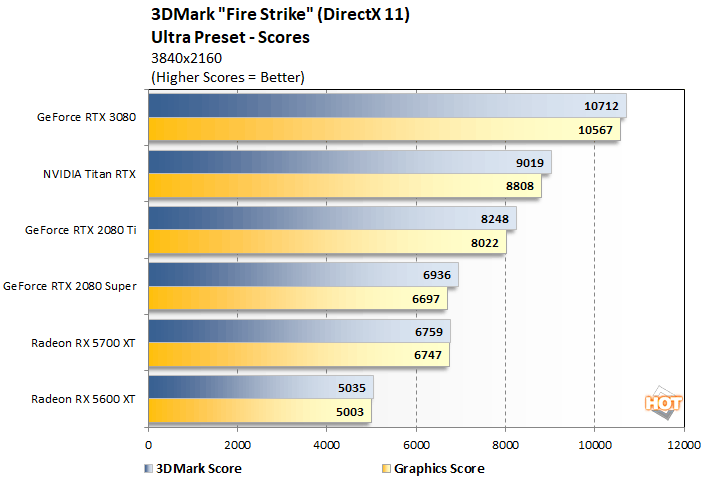
3DMark Fire Strike has multiple benchmark modes: Normal mode runs at 1920x1080, Extreme mode targets 2560x1440, and Ultra mode runs at a 4K resolution. GPU target frame buffer utilization for normal mode is 1GB and the benchmark uses tessellation, ambient occlusion, volume illumination, and a medium-quality depth of field filter. The more taxing Extreme mode targets 1.5GB of frame buffer memory and increases detail levels across the board. Ultra mode is explicitly designed for high-end and CrossFire / SLI systems and cranks up the quality even further. GT 1 focuses on geometry and illumination, with over 100 shadow casting spot lights, 140 non-shadow casting point lights, and 3.9 million vertices calculated for tessellation per frame. GT2 emphasizes particles and
GPU simulations.
3DMark Fire Strike
GeForce RTX 3080 Fire Strike Ultra Details
Our results in the DX11-based Fire Strike benchmark mirror what we saw in Time Spy. The GeForce RTX 3080 dominates the rest of the field, besting every other card by a wide margin.
|
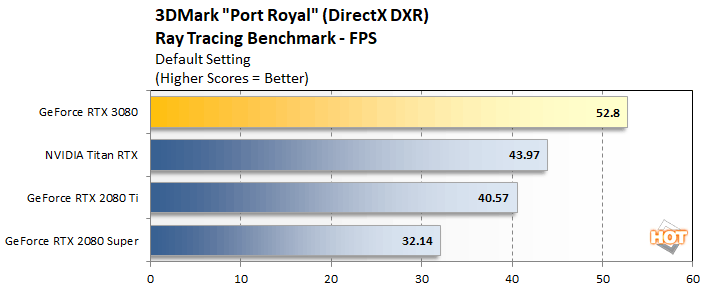
| UL 3DMark Port Royal |
| DXR Ray Tracing Benchmark |
|
Port Royal was released earlier this year as an update to UL’s popular
3DMark suite. It is designed to test real-time ray tracing performance of graphics cards that support Microsoft DirectX
Raytracing, or DXR. Although
DXR is technically compatible with all DX12-class GPUs, the graphics card must have drivers that enable DXR, and NVIDIA is the only company to have done so at this point, hence the lack of Radeons in the chart.
3DMark Port Royal
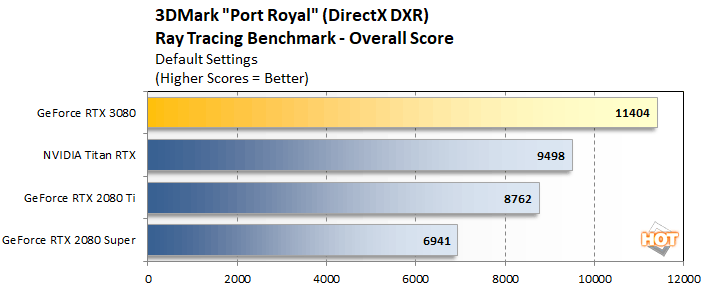
GeForce RTX 3080 Port Royal Details
The GeForce RTX 3080 puts up a Port Royal
ray tracing score nearly 1.65X higher the GeForce RTX 2080 Super, and again, even beats the powerful Titan RTX by a significant margin.