Maingear ZERO Gaming PC Review: The Cleanest Desktop PC Ever
Maingear ZERO Gaming PC Review: CPU, System, Productivity And Gaming Benchmarks

The hardware in our Maingear ZERO test system is quite familiar. We've reviewed and tested Intel's Core i9-14900K in multiple systems, and it's an extremely close cousin to the Core i9-13900K, which we've also reviewed and tested quite a bit. On the graphics side of things, we've only reviewed the GeForce RTX 4080 SUPER, but once again, it's a close cousin to the original recipe GeForce RTX 4080, so we had a pretty good idea of what to expect from this system, but it did surprise us a couple of times. Let's dive in.
ATTO Disk Benchmark
The ATTO disk benchmark is a quick and simple test which measures read/write bandwidth across a range of different data sizes. While we don't typically compare these results across multiple machines, it's useful to gauge whether a particular system's storage subsystem can handle being put under pressure.
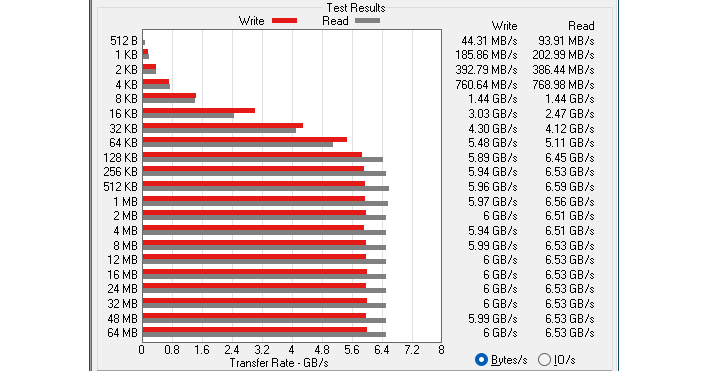
Maingear outfitted the ZERO with a Teamgroup T-Force Cardea A440 Pro SSD. This is a fairly high-end PCIe 4.0 SSD based around Phison's E18 controller. As such, it puts up excellent performance, especially in reads. (Note that we are bypassing the OS's write cache here.) ATTO uses a fairly realistic queue depth of just 4; if we raised the queue depth and performed a multi-threaded test like in CrystalDiskMark, it's possible to exceed 7 GB/sec on this drive. Notably, this system exceeds the I/O performance of the RAID 0 stripe found in the Dell Precision 7875 we just reviewed at low transfer sizes.
Speedometer 2.0 Benchmark
Here we have numbers from the Speedometer 2.0 test available at browserbench.org. Scores in this benchmark are indicative of the performance users will see when browsing the web and running advanced web apps using a large array of JavaScript frameworks. All of the systems were tested using the latest version of Microsoft's Edge browser, with default browser settings, on a clean, fully-updated install of Windows 11.
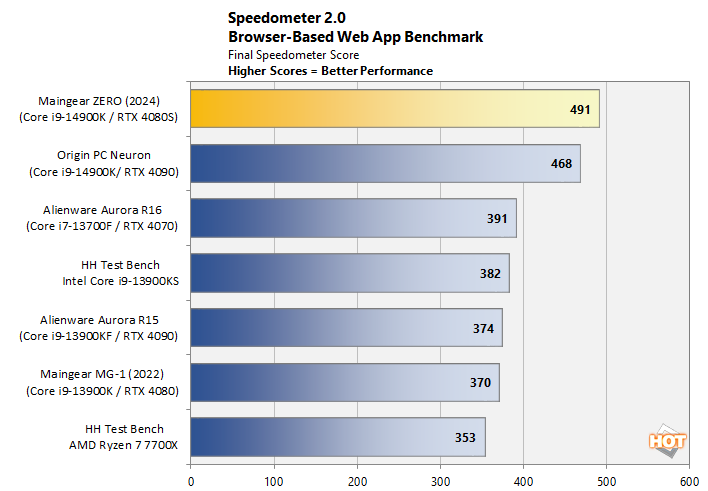
We're not completely sure if the Core i9-14900K's dominating performance in this benchmark is down to optimizations by Intel (like those made for its Intel Application Optimizer) or simply software changes since we benchmarked the older hardware, but either way, the performance of the Core i9-14900K in web apps is completely unparalleled. The Maingear ZERO steps slightly ahead of the Origin PC Neuron using the same CPU, but these benchmarks are a little newer, too.
Cinebench R23 Rendering Benchmark
Contrary to popular belief, Cinebench isn't a synthetic benchmark. It's a rendering performance test based on Maxon's Cinema 4D, which is a 3D rendering and animation suite used by studios like Sony Animation and many others. It's very demanding on system processor resources, and it can utilize any number of threads, which make it an excellent gauge of computational throughput. The rate at which each test system was able to render the entire scene is represented in the graph below.
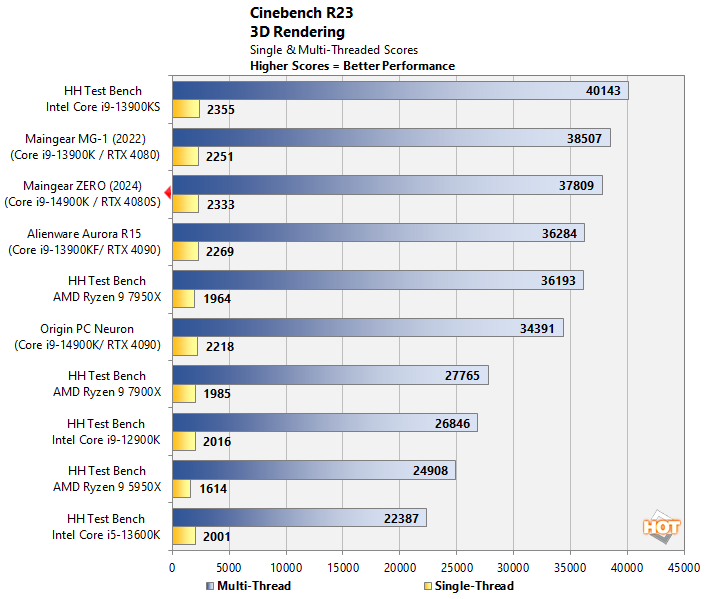
Curiously, the Maingear ZERO falls down a little in the rankings in this test, although it's still among the very fastest gaming machines we have ever tested in Cinebench R23. If you're serious about doing 3D rendering, you should probably consider a workstation PC, but if you're just doing it as a hobby, a system like this will still give you excellent performance. Check out that single-threaded score, which is essentially on par with the 6 GHz Core i9-13900KS.
Blender 3D Rendering Benchmark
Blender is a free and open source 3D creation suite that can handle everything from modeling, rigging, and animation to simulation, rendering, compositing and motion tracking. It has a purpose-built benchmarking tool that includes three pre-built scenes to render out while tracking the time it takes to completely render each scene.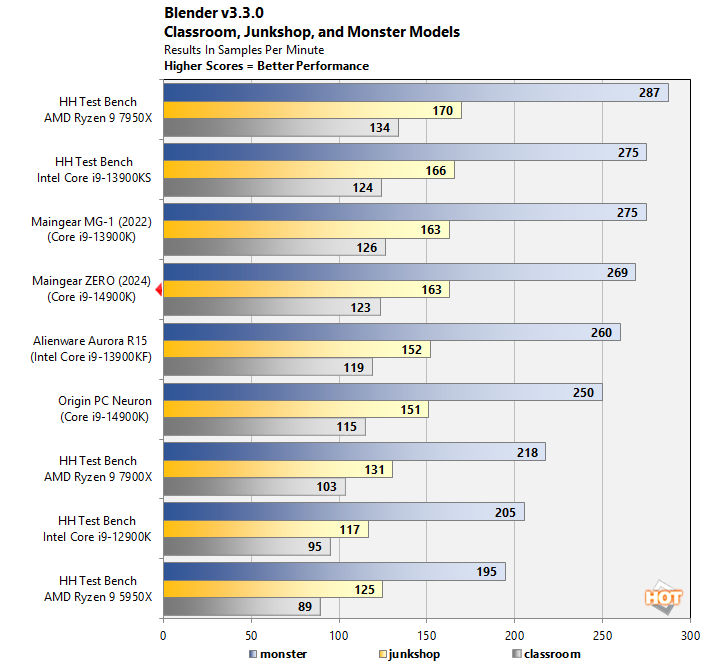
Performance in Blender on the Maingear ZERO is more or less as expected. This benchmark is surprisingly consistent and we couldn't say with any certainty why the Core i9-14900K in our machine doesn't cleanly defeat the Core i9-13900K in the MG-1 we tested, but it may have something to do with Intel's focus on single-threaded performance in the 14th-gen CPUs; we saw the same thing in our review of this CPU. This is a great result, regardless.
Geekbench v5.4.1 System Benchmark
In the GeekBench tests, we're skipping the GPU and stressing only the CPU cores in a system with both single and multi-threaded tasks. The tests encompass encryption, image compression, HTML5 parsing, physics calculations, and other general purpose compute workloads.
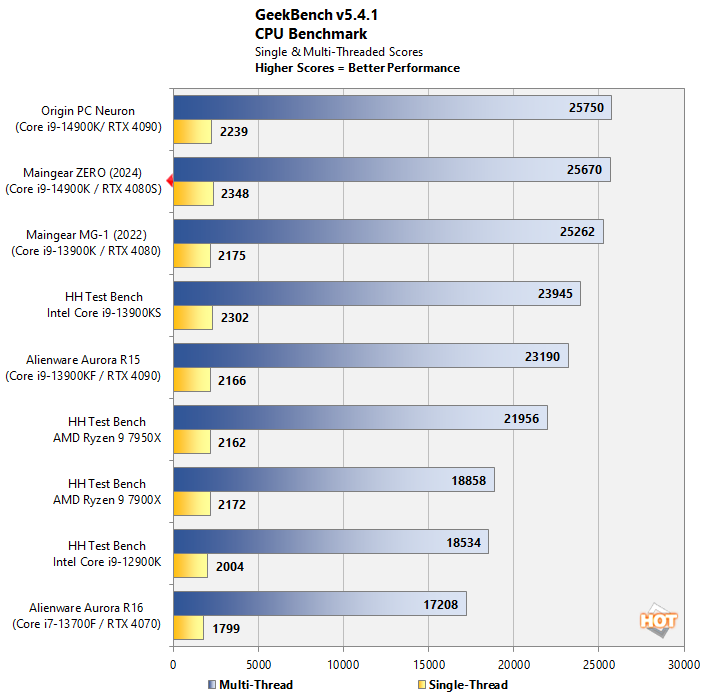
Maingear's ZERO puts up a fantastic showing in this benchmark. The multi-threaded result is essentially the same as the Core i9-14900K in OriginPC's system, while the single-threaded result is a fair bit faster—the fastest we've ever seen in this benchmark, actually. Chalk this win up to newer firmware, driver updates, or Windows updates, perhaps. Another excellent result for Maingear and Intel.
PCMark 10 System Productivity And Content Creation Benchmark
PCMark 10 uses a mix of real-world applications and simulated workloads to establish how well a given system performs productivity tasks, like image and video editing, web browsing, and OpenOffice document editing. These scores appear to be more neatly clustered than some comparison sets, but we should still note that the systems are sorted by their overall PCMark score, which is the first (gray) bar in each cluster.
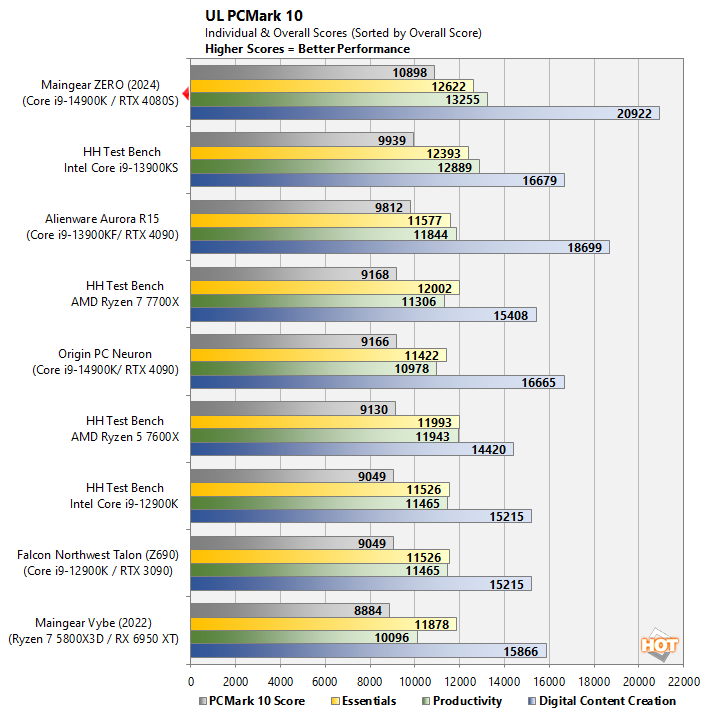
This result was somewhat unexpected. We ran this benchmark five separate times and these results are consistent. The "Essentials" system score and the "Productivity" office applications score are both more or less where we'd expect them to be, but the Digital Content Creation score, normally heavily dependent on the system's GPU, is out of this world, beating even systems with GeForce RTX 4090s. It's not completely clear why this is the case, but it could be down to NVIDIA driver improvements, the massive 64GB of system memory, or even the fast 6000 MT/s memory transfer rate. Either way, chalk up another win for Maingear.
3DMark Time Spy DirectX 12 Gaming Benchmark
As usual, we'll start off our 3D benchmarking with 3DMark. If you're somehow unfamiliar, 3DMark is a synthetic game-like benchmark for assessing gaming graphics (GPU) and physics (CPU) performance. This tool has a wide variety of tests and demos that target various types of graphics workloads to give a better picture of how a system will handle real games. First, we used the Time Spy benchmark, 3DMark's DirectX 12 test. This test has multiple presets, but the standard Time Spy test is plenty taxing.
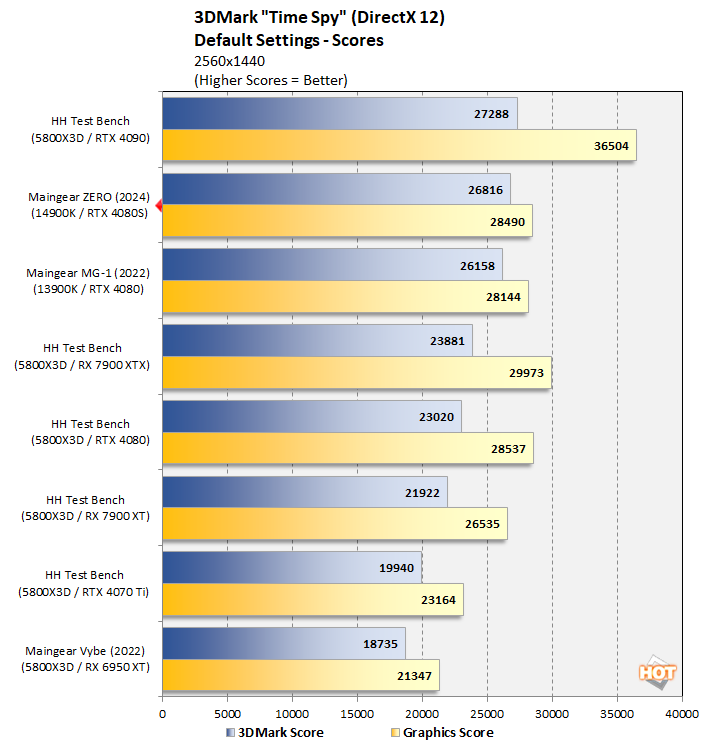
Bolstered by an extremely high CPU score (not shown), the Maingear ZERO presents an excellent overall 3DMark score despite turning in a lower graphics score than you could get with a more powerful graphics card. This result is completely unsurprising and we really have nothing to say about it, so let's move on.
3DMark Port Royal DirectX Raytracing Benchmark
Port Royal was released as an update to UL's popular 3DMark suite. It is designed to test the real-time ray tracing performance of graphics cards that support Microsoft DirectX Raytracing, or DXR. Although DXR is technically compatible with all DX12-class GPUs, the graphics card must have drivers that enable support for the feature.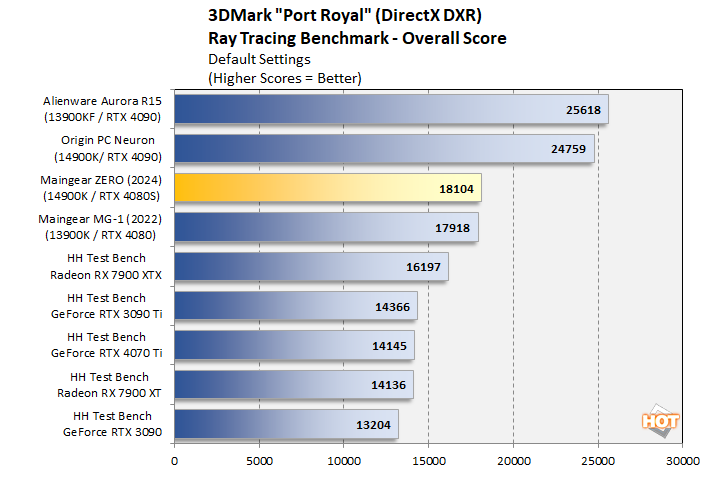
This test cares very little about anything in the system besides the graphics card and its drivers. Unsurprisingly, our machines with GeForce RTX 4090 cards zoom out ahead, while the Maingear ZERO and its GeForce RTX 4080 SUPER come in directly ahead of the MG-1 with its original recipe GeForce RTX 4080. Once again, there's not much to say here -- the GPU is performing as expected. Let's move on to some real game benchmarks, shall we?
Final Fantasy XIV Endwalker MMORPG Benchmark
Final Fantasy XIV: Endwalker launched at the end of 2021, and as usual, Square-Enix updated its free character creator and benchmark tool. The free utility checks in at approximately a 2.21GB download. It will test your PC's ability to run the game at various settings, and presents a final result with an overall rating upon its conclusion. We tested Final Fantasy XIV: Endwalker in 4K UHD, with "Maximum" image quality settings.
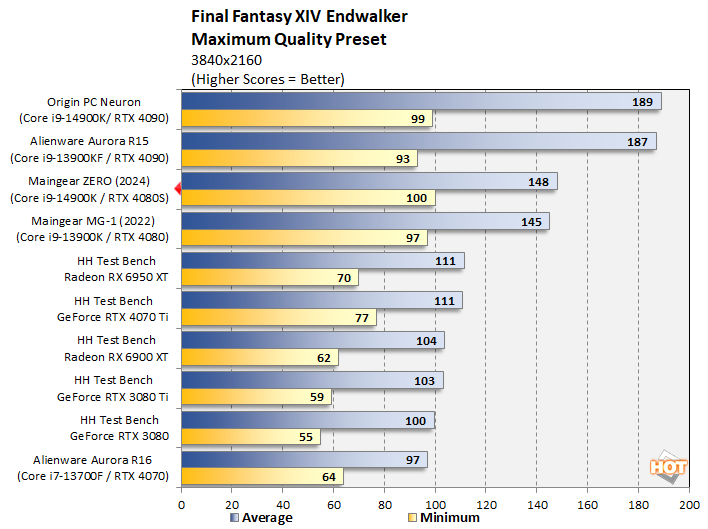
Once again, the Maingear ZERO turns in a chart-topping performance—at least, if you ignore the two much more expensive machines above it with GeForce RTX 4090 cards. The RTX 4080 SUPER scoots just ahead of the original RTX 4080; notably, the ZERO is the first machine to skip past a triple-digit minimum framerate in this test. Solid stuff. We're keen to see how things evolve when Square-Enix releases this title's graphical update later this year.
Forza Horizon 5 Racing Game Benchmark
Forza Horizon 5 is currently the latest edition of Microsoft and Playground Games' popular open-world racing franchise. This title leverages the proprietary ForzaTech engine and DirectX 12 Ultimate to deliver much larger maps than its predecessors, with more detailed models and higher graphics fidelity in general including some ray-traced reflection effects. We tested the game in 4K with the "Extreme" graphics preset.
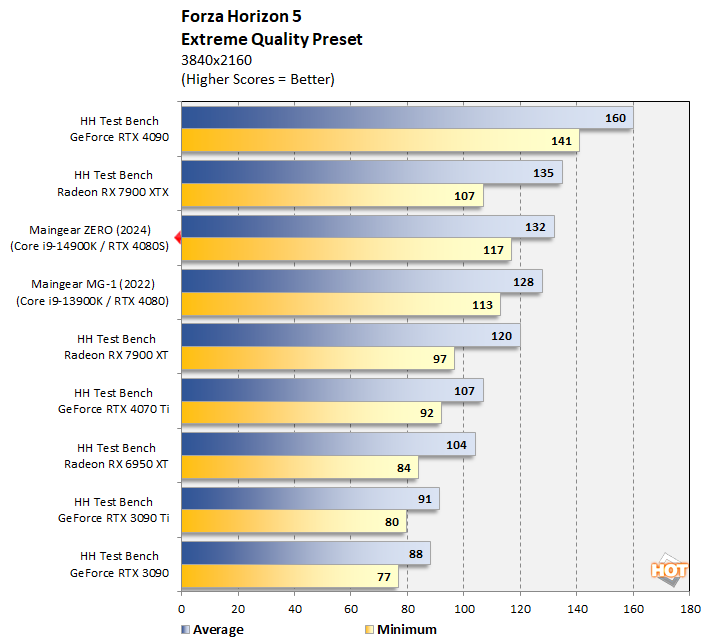
Forza Horizon 5 is notable for its extremely consistent performance. The ForzaTech engine is tightly optimized, and we achieve a minimum framerate very close to 120 FPS without even using any kind of upscaling. If you're into Forza, you really couldn't do much better than the ZERO.
Marvel's Guardians of the Galaxy Benchmark
Marvel’s Guardians of the Galaxy is an action-adventure game where you play as Star-Lord and lead the rest of the Guardians from mission to mission. The game’s minimum requirements call for hardware as meager as a Radeon RX 570 or GeForce GTX 1060-class GPU, but it also supports some of the latest graphics technologies, including DXR and DLSS. We tested in 4K UHD with every in-game setting maxed out.
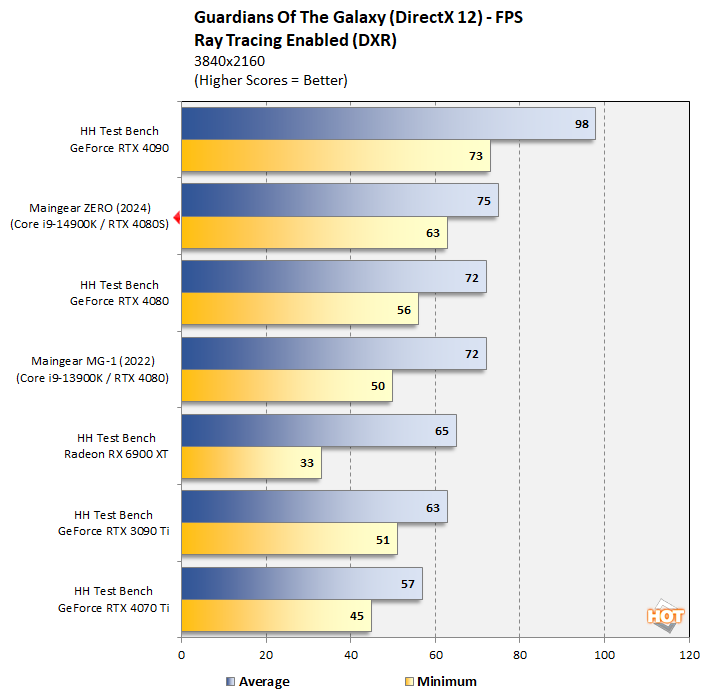
No real big surprises here, although it seems like Guardians might prefer the extreme single-threaded speed of our Core i9-14900K over the short memory latency of the Ryzen 7 5800X3D used in our test bench data. We finally manage a minimum framerate over 60 FPS in this test, which is fantastic.
F1 22 Formula 1 Racing Benchmark
F1 2022 is the previous iteration of Codemasters' Formula One racing simulation, and like previous versions of the game, it sports impressive visuals. This was the first year that the game included support for DirectX 12 Ultimate out of the box, and it incorporates a number of AMD and NVIDIA technologies like FSR 2.2 and DLSS Frame Generation. We tested F1 2022 with its Ultra High graphics preset, without upscaling.
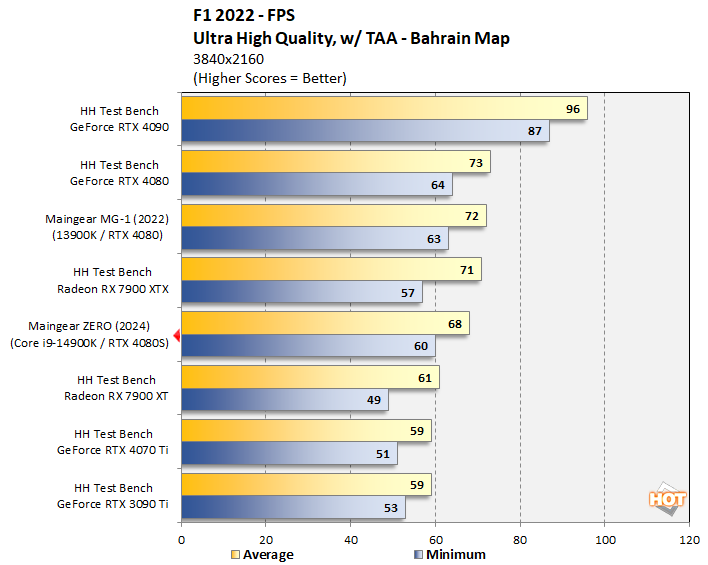
After all of the great results above, we come to an unexpected showing in F1 2022. Now, don't get it twisted—this is still excellent performance, with a minimum frame rate of 60 FPS. However, it is lower than expected given the results we've seen on other machines. We think that this might be down to F1 2022 being sensitive to memory latency, as our Ryzen 7 5800X3D machine with a GeForce RTX 4080 finishes a few percentage points ahead. In any case, as we said, this isn't a bad result, just a little lower than we expected.


