Futuremark is a familiar name in the computer hardware industry, thanks to its popular PCMark and 3DMark benchmarking suites. We put Maingear's Potenza through both tests and compared the scores to results from similar systems we’ve recently reviewed. We also ran the system through the Fire Strike test in Futuremark’s updated 3DMark benchmark suite.
 |
| PCMark 7 |
| Simulated Application Performance |
|
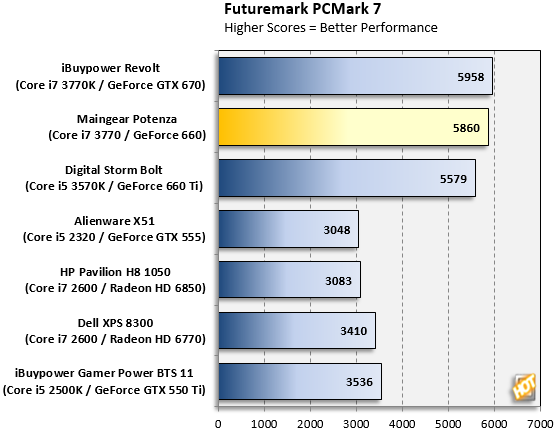
Many of the benchmarks here focus on PC games and graphics, which is what you’d expect in a review of a system designed for gaming and entertainment. But you’ll also likely use your Maingear Potenza for other tasks, as well, and that’s where PCMark 7 can give you a sense of the system’s capabilities. It runs multi-threaded tests that simulate office tasks and general usage, then gives the system a score.
The Potenza's PCMark 7 score puts the computer right about where we would expect to see it: between the iBuypower Revolt (which boasts an Intel Core i7 3770K CPU and an Nvidia GeForce GTX 670 graphics card) and the Digital Storm Bolt (which has a Core i5 3570K CPU and a GeForce 660 Ti). The computer is clearly competent to handle day-to-day office tasks and Web browsing.
 |
| Futuremark 3DMark 11 |
| Simulated Gaming Performance |
|
Futuremark’s 3DMark 11 is a well-respected gaming test suite. Like PCMark 7, this benchmark runs the system through a battery of tests and provides a score for comparison. But here, the tests are generally more graphics-oriented.
Although 3DMark 11 has been around for a while, it's a good tool for spotting serious gaming capabilities. The GTX 660 is a solid card, and it shows here. In fact, the Potenza's score is a little better here than you might expect from this configuration.
|
| Futuremark 3DMark Fire Strike |
| Simulated Gaming Performance |
|
We also put the Potenza through Futuremark’s new 3DMark Fire Strike test, which has Normal and Extreme modes. Because Extreme mode is geared towards systems that have multiple graphics cards in CrossFire or SLI configurations, we opted for Normal mode, which runs at 1920 x 1080. As a result, we don’t have comparison data at the moment, but our data pool will grow quickly as we run more review systems through this test.
There are two sets of numbers to look for with the Fire Strike results. The first is the score, which is broken into an overall score and a separate graphics score. The other provides a breakdown of the system's performance in the individual tests that were run. Again, there isn't much to say about the Potenza's scores in this benchmark, other than to say it is a good result, so we'll dig into some of the other tests for this gaming PC.