Mac mini 2020 Review: Apple M1 Silicon Performance Deep Dive
Apple M1 Mac mini: Power, Efficiency And Performance Comparisons
Apple Mac mini 2020 Power Efficiency
It's important for us to contextualize the Mac mini's performance in a couple of ways. Chief among this is power efficiency. The Mac mini is a small desktop, but the 2018 model we have on hand draws around 85 W from the wall while running Cinebench R23. According to Intel's listing on its CPU Ark, the Core i5-8500B inside of the 2018 Mac mini is a 65 W processor, and no power supply is 100% efficient. Not to mention it has to power memory, storage, and its integrated GPU, so that seems like a reasonable number for that system.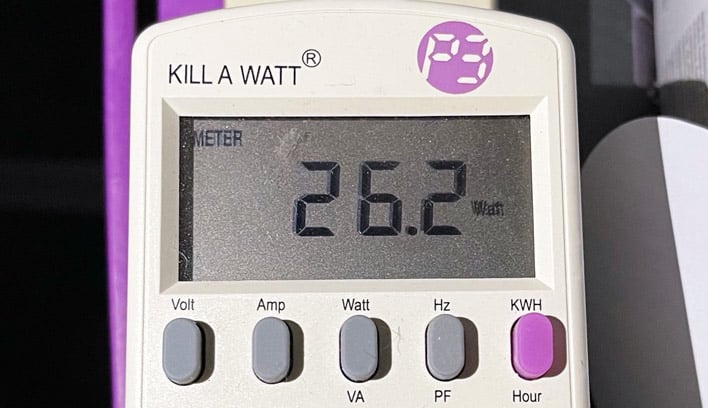
The 2020 model of the Mac mini needs to draw the same power or less, while offering similar performance in the same workload. Apple's specifications say that the Mac mini has a maximum continuous power rating of 150W, but we're guessing that has more to do with the power supply than the system itself. That's because when it's running the same Cinebench load as the older model, the 2020 Mac mini only draws around 25 - 26 W at the wall. That's less than 1/3 the power of our upgraded 2018 model. At idle, that power consumption drops to just 5 W, which is pretty incredible.
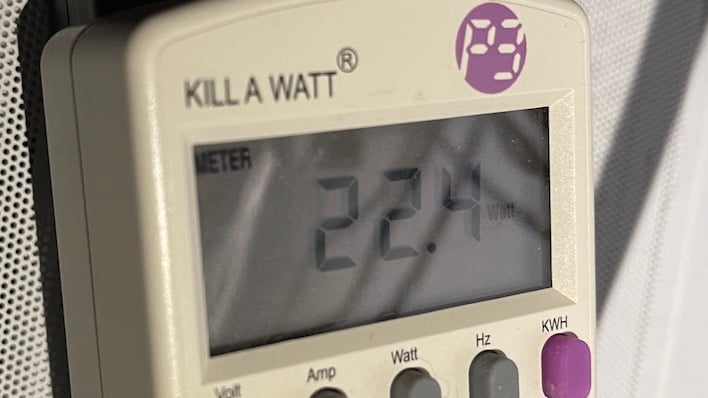
When it came to testing how much power the system drew while gaming, we thought something was wrong with our Kill-A-Watt, and ended up testing in three different games: Diablo 3, Shadow of the Tomb Raider, and GRID: Autosport. The latter are benchmark staples for us, while Diablo 3 just happened to be a game that runs on the Mac platform. All three games showed the system actually drawing less power in gaming loads than it did in Cinebench. The most we ever saw it pull at the wall was 22 Watts, and that was only for a short spike. It was much more likely to pull 20-21 Watts during gaming.
This likely explains one other anomaly in our testing: the Mac mini didn't make much noise. When the 2018 Mac mini gets going, it gets quite warm to the touch and the fan really cranks the hot air out of the system. The 2020 model just doesn't do that. Our sound meter never registered anything we could directly attribute to the Mac mini during a 30-minute stability test in Cinebench R23. It just didn't make a sound. There's a fan in there, and we could feel a little bit of a breeze, but it was barely spinning.
In short, the 2020 Mac mini seems to just sip power. If the performance even just matches the 2018 model, this represents an incredible stride in power efficiency for the Mac platform. It'd be a flat 3x increase in power efficiency. On the other hand, if the performance gains are anywhere near what Apple claims, the magic of multiplication seems to imply that we could see a 6x to 8x increase in performance per Watt, which seems incredible. This is why everyone was so skeptical at Apple's claims. But now it's time to test that performance. We can quantify this, of course, by using a very specific amount of work: the time it takes to render the test scene in Cinebench R23.
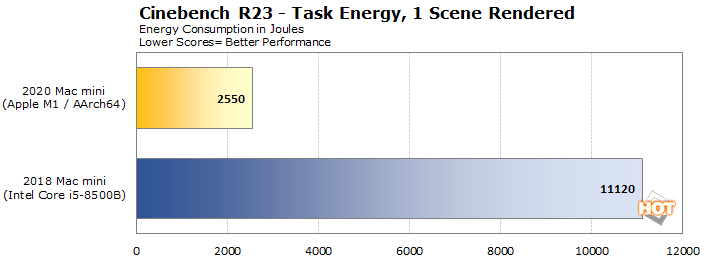
Let's talk about where these numbers came from briefly. These figures were calculated by hand using a stopwatch and a Kill-A-Watt, so it might not be quite as exact as it looks in the graph. Without giving away all the benchmarks below, we can tell you that the Coffee Lake six-core Intel Mac mini takes 2:19 to complete a single pass in Cinebench R23 and uses around 80 W to do it. That works out to around 185 Watt-minutes, or 3.08 Watt-hours (11.12 kilojoules). Meanwhile, the M1 Mac mini takes 1:42 and uses around 25 W. That's around 0.71 Watt-hours, which works out to 2.55 kilojoules.
That means for energy to complete this well-defined rendering task (one pass through the Cinebench R23 rendering benchmark), the Mac mini uses less than 25% of the energy of the previous model. Stated another way, it's four times as energy efficient. Suddenly Apple's efficiency claims don't seem ridiculous.
Mac mini 2020 System Performance: M1 Explored
It took us a little bit to come up with a decent suite of benchmarks that run on both Macs. As it turns out, we can test a pretty wide array of workloads using some familiar tools from both our phone and PC reviews. Because most Mac buyers know they want a Mac and its macOS applications (or maybe just the hardware to build iOS apps for distribution on the App Store) we're not really interested in comparing this machine against PCs.
However, we will add reference data from one notebook: Dell's XPS 13 9310 2-in-1. We're not really treating the system like a notebook, though. Since the Mac mini is a desktop system, we feel no need to hold the Tiger Lake CPU back, so we used the Best Performance option on the Windows energy control panel and turned up the fan profile to Ultra Performance in the Dell Power Manager utility. Since the Mac mini is a desktop, we did not want to artificially constrain the Tiger Lake notebook by letting the fans spin down when there was more performance on the table. This fact is why it doesn't appear in the Task Energy chart above, since this lets the system use more power.
This seems like an unfair fight of desktop vs. notebook, but it turned out to be closer than we might think. To test the XPS 13's power draw, we turned the display brightness slider all the way down to 0. The notebook still has to power the screen, but this is as good as we can do without disconnecting the display from the motherboard. With the system as unbridled as we can get it, our Kill-A-Watt shows this Tiger Lake notebook drawing 45 to 47 Watts from the wall during the early stages of a Cinebench run. Once the system heats up, that actually drops a bit, but it never dropped below ~35 W in a full 30 minute stability test. The XPS 13 has a display to power, sure, but it seems like the core components might be drawing just as much power as the Mac.
|
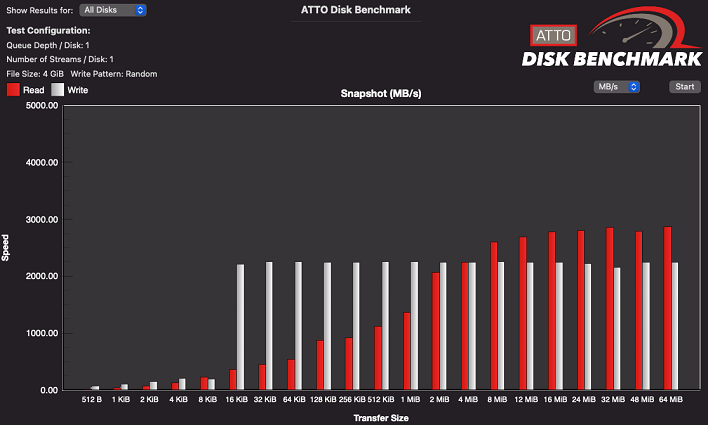
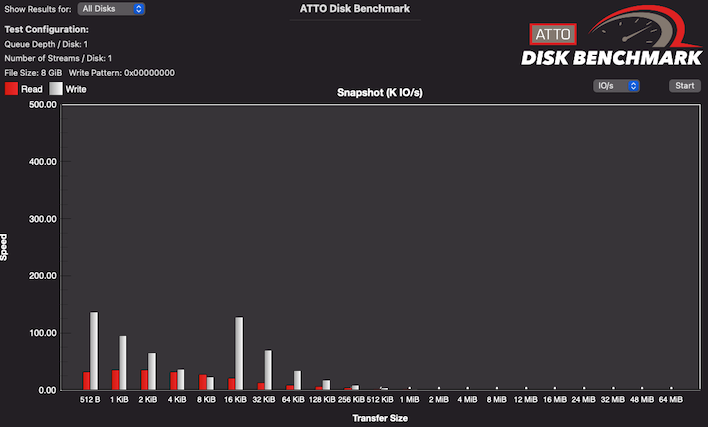
The Mac mini's storage setup makes for some weird-looking bar graphs. Writes max out at more than 2.5 GB per second very early on and hold steady. Meanwhile, the reads can really hang in there with some of the speedier SSDs we've looked at. While the Mac version of ATTO is Intel-only, the M1 had no problem keeping the reads and writes moving. The IO per second chart looks just as unusual with its big spike at the 16 kB mark. We're not clear why it exhibits this performance, but the SSD boots quickly and apps start in a very snappy manner, so it feels pretty quick, at least.
|
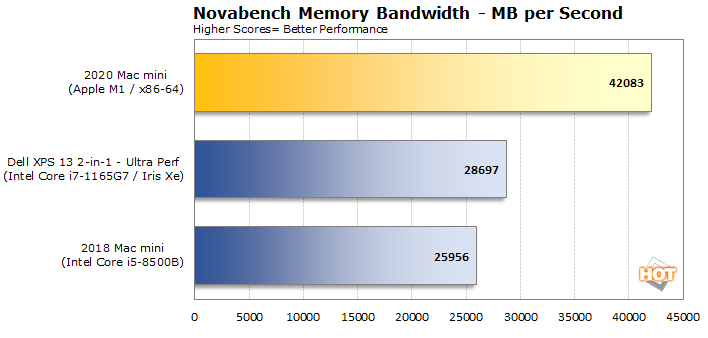
Apple doesn't seem to hit the very top of its bandwidth capabilities in Novabench, but we're not sure if that's due to being an x86-64 native application, or just some sort of limitation of the memory controller. Either way, it doesn't seem to matter as it's able to extract more bandwidth out of Apple's unified memory architecture than either the 2018 Mac mini or even the Tiger Lake-based XPS 13. Integrated graphics processors are often held back by insufficient memory bandwidth, so we'll have to see if this means anything for gaming performance.
|
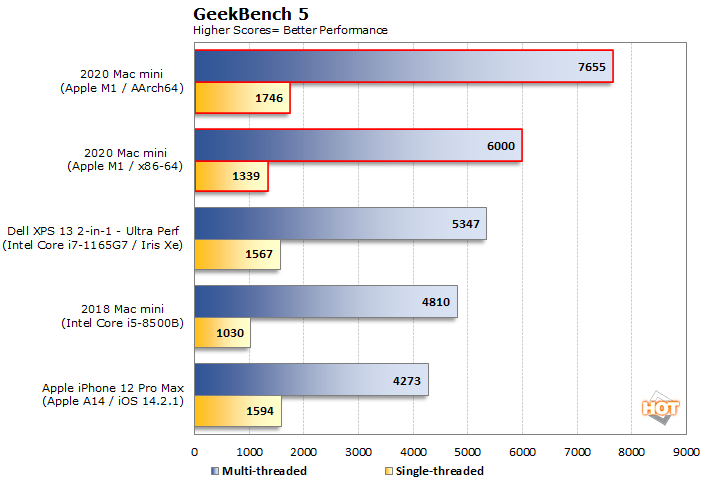
The Core i7-1165G7 posted a single-threaded score around 10% slower than the Apple M1 in the Mac mini when the M1 is running Arm64 code. That alone is quite a feat for Apple, assuming that the real-world tests that follow exhibit similar performance. The gap between the M1's native performance and Rosetta 2's x86 speed is a bit greater, approaching 20% on both single and multi-threaded tests. However, that's not enough of an impediment to bury the Coffee Lake-based Mac mini with a six-core Core i5-8500B. At least in Geekbench, even emulating an x86-64 processor is not enough to slow the M1 down below the previous-gen offering.
|
There are a lot of results here. First, the 2020 M1 Mac mini appears three times in each graph: once with Safari running natively and twice with Chrome running Arm64 and x86-64 code. We also tested the 2018 Mac mini with both Safari and Chrome as points of comparison, along with the XPS 13 in Chrome and an iPhone 12 Pro Max with Safari. There's a lot to digest here, so let's do it.
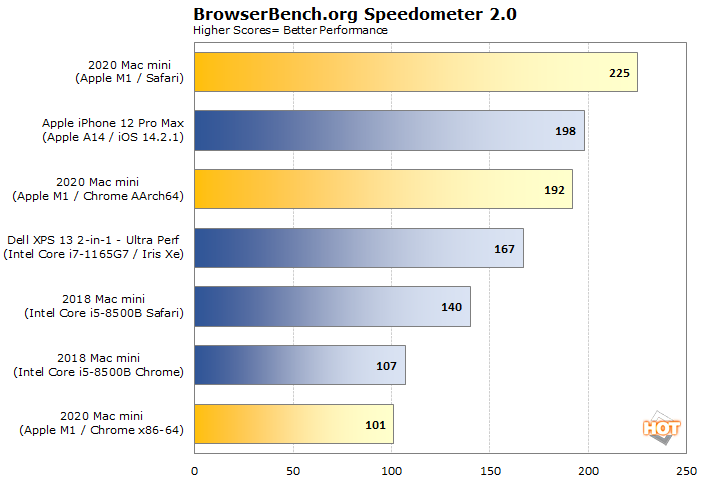
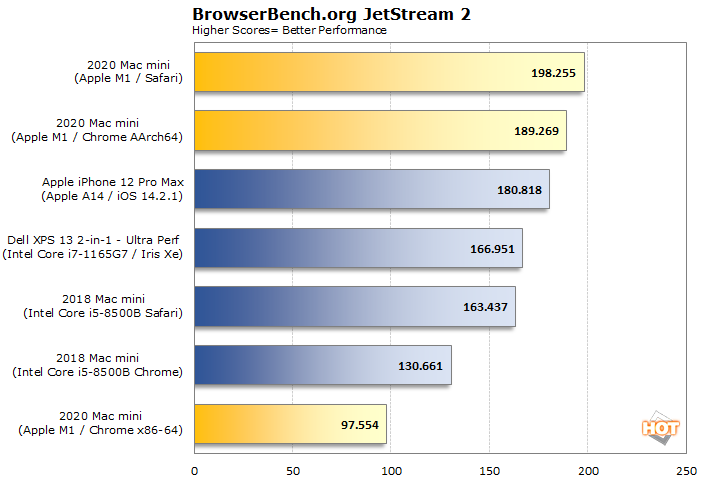
First of all, the 2020 Mac mini is incredibly fast here. Considering its $700 price tag, it might be the fastest low-cost web workstation around. Only part of that owes to the M1 silicon, too. Safari was just flat-out faster in both tests on both Macs. The older Mac mini almost entirely negates Tiger Lake's single-threaded advantage in JetStream, and makes up some solid ground on the XPS 13 when using Safari.
Google also apparently did a great job optimizing Chrome for Apple's hardware, and might only serve to make owners of Windows on Arm devices like the Galaxy Book S and LG Flex 5G a little jealous. At least Windows owners can run Edge natively, which Microsoft brought to that platform back in February. Meanwhile, the Mac version of Edge is still x86-only.
Regardless of the reason for its excellent performance, Apple's silicon took gold, silver, and bronze on both tests.
|
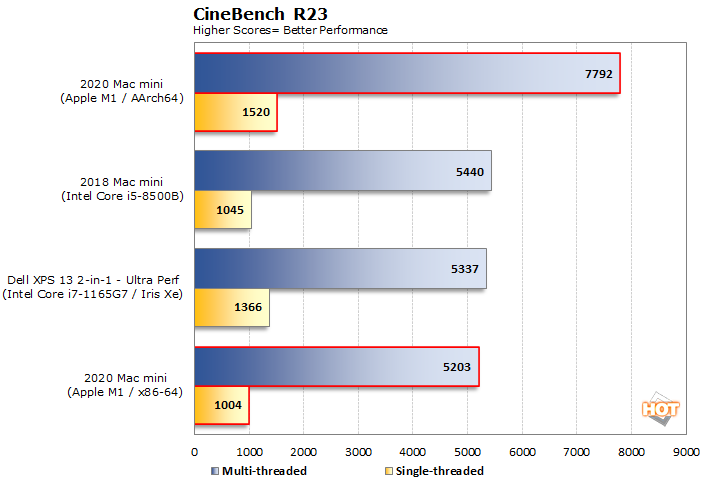
As it did with Geekbench, Apple's M1 charts new territory for single-threaded performance. Unlike an ultraportable notebook where most folks are not buying it to render scenes all day, we can imagine a small render farm full of Mac minis creating all the frames of an animated video. Such a farm would chew through those frames pretty quickly, too, as it outpaced all of our contenders by quite a bit. Surely that owes somewhat to the extra four cores, even though they're energy-efficient cores meant for background tasks. Cinebench renders eight segments at a time on the Mac, so those cores are getting a workout.
Even with seven arms tied behind its back, the M1's performance is very impressive. The Mac mini posted the fastest single-threaded score of our pack and was once again around 10% faster than the Core i7-1165G7. This was one test where x86-64 emulation in Rosetta 2 wasn't eye-popping, as the Mac mini also brought up the rear. However, both the single and multi-threaded scores were very close to the Core i5-8500B in the older Mac.
|
That's why we've added a third test: Aztec Ruins. This uses Microsoft's DirectX 12 3D APIs and should level the playing field a little bit between these two totally unrelated interfaces on completely separate platforms. At least the scenes are identical. We ran the off-screen 1080p tests for each scene so that the refresh rate or pesky things like v-sync didn't get in the way. We also added 1440p for Aztec Ruins, since it was just a checkbox away.
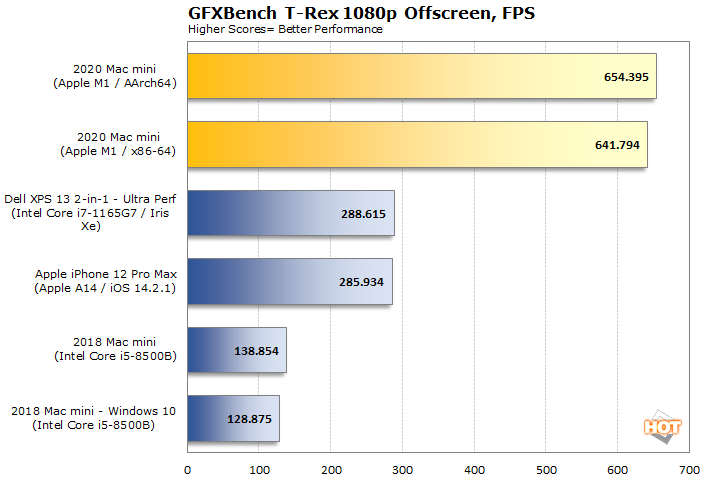
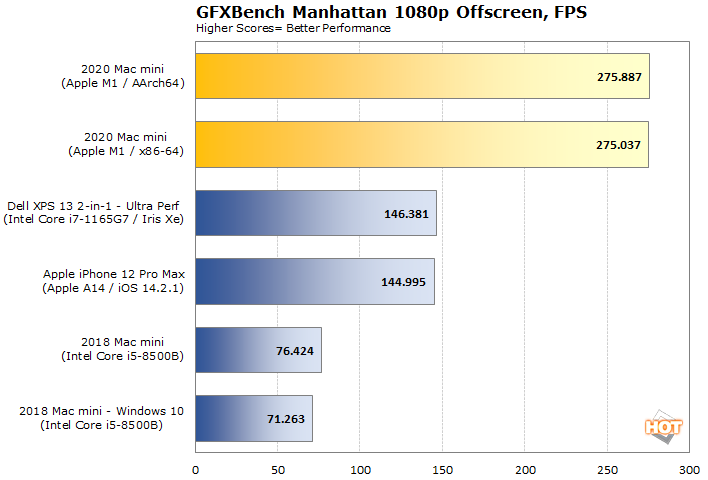
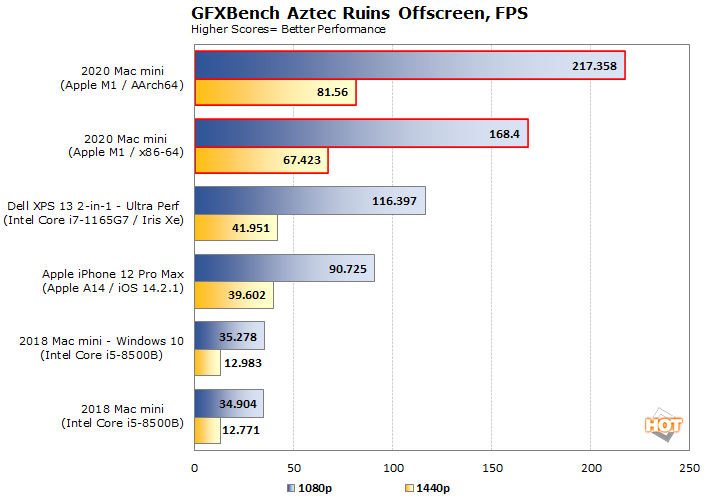
Overall, the various systems fell into roughly the same pecking order. The M1 Mac mini sits at the top and the 2018 Mac mini with its aged UHD 630 integrated graphics brings up the rear. What's interesting is what happens in the middle. During the first two tests, using x86-64 emulation did nothing to the T-Rex and Manhattan tests' performance, and that Mac mini ran away with an enormous victory. However, DX12 did not help the Tiger Lake system and the gulf between the two is still pretty enourmous. Meanwhile, in Aztec Ruins, x86-64 emulation had a much more profound effect on performance and that run was around half-way between the Core i7-1165G7 and the M1 running native code.
The 2018 Mac mini brings up the rear twice. We ran all of our 3D tests in both Big Sur and Windows via Boot Camp when possible.
|
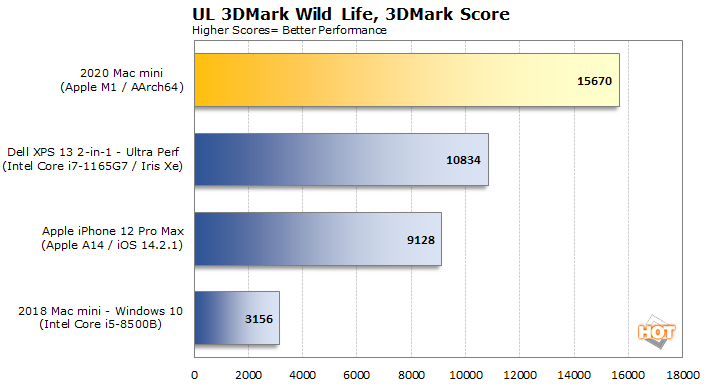
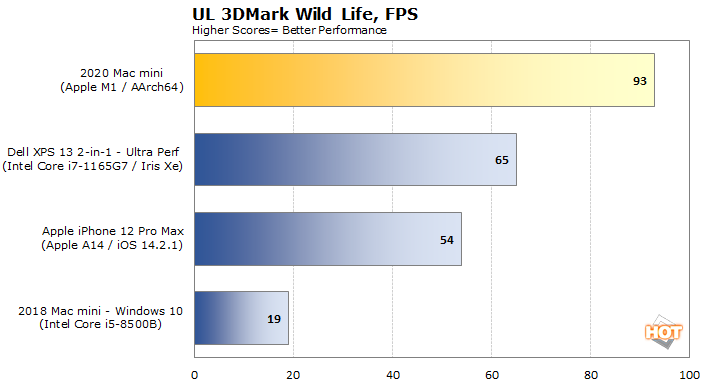
Performance is, again, really great. The M1 Mac mini outpaces all comers, beating the Iris Xe graphics in the Core i7-1165G7 by 50%. Intel scores a clear victory over the iPhone in this go-around, however. Because 3DMark is an iOS app and because iOS apps don't run on x86 Macs, all we have is Windows for the 2018 Mac mini. There's also only one score for the M1 Mac mini for that same reason.
The benchmarks aren't finished. Head on over to the next page to see how the Mac mini's GPU runs in the context of actual games and find out how Apple's Logic and Final Cut run on the new Mac mini.


