Meteor Lake Core Ultra Review: Intel's All New Tile CPU Tested
Intel Core Ultra Meteor Lake Review: System, Graphics, And Gaming Benchmarks

Speedometer 2.0 Browser Benchmark
We use BrowserBench.org's Speedometer test to take a holistic look at web application performance. This test automatically loads and runs several sample web apps from ToDoMVC.com using the most popular web development frameworks around, including React, Angular, Ember.js, and even plain-Jane JavaScript. This test is a better example of how systems cope with real web applications in comparison with a pure JavaScript compute test like JetStream. All tests were performed using the latest version of Chrome.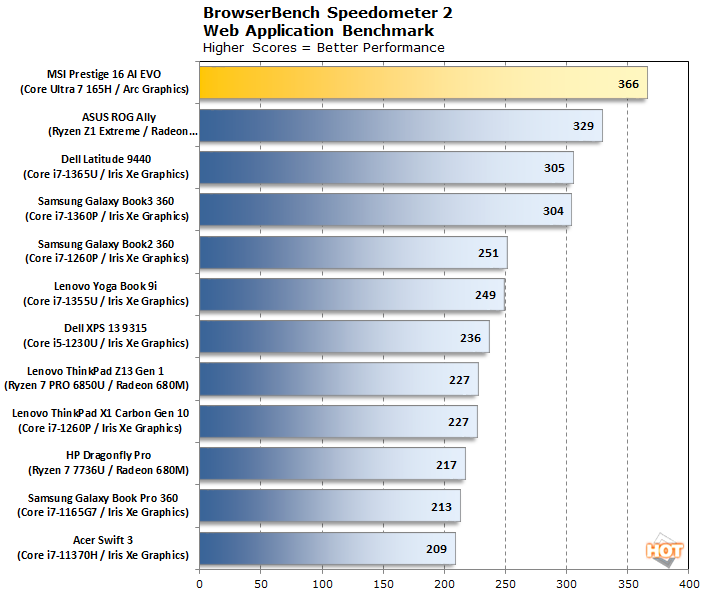
Intel's newest mobile CPU marks down its first win of the day in the Speedometer 2 benchmark. This isn't the highest result we've ever seen in Speedometer, but it's darn close, and hangs tough with many full-power desktop CPUs. That's extremely impressive for a 28W mobile chip. This is an excellent showing for Intel out of the gate.
Maxon Cinebench 3D Rendering Benchmarks
Next up is the previous-generation 3D rendering benchmark from Maxon, based on the Cinema 4D R23 rendering engine. It's a purely CPU-based test that doesn't make use of the graphics processor at all, and it scales very well with additional CPU cores. We ran both single- and multi-threaded tests on all of the notebooks represented here.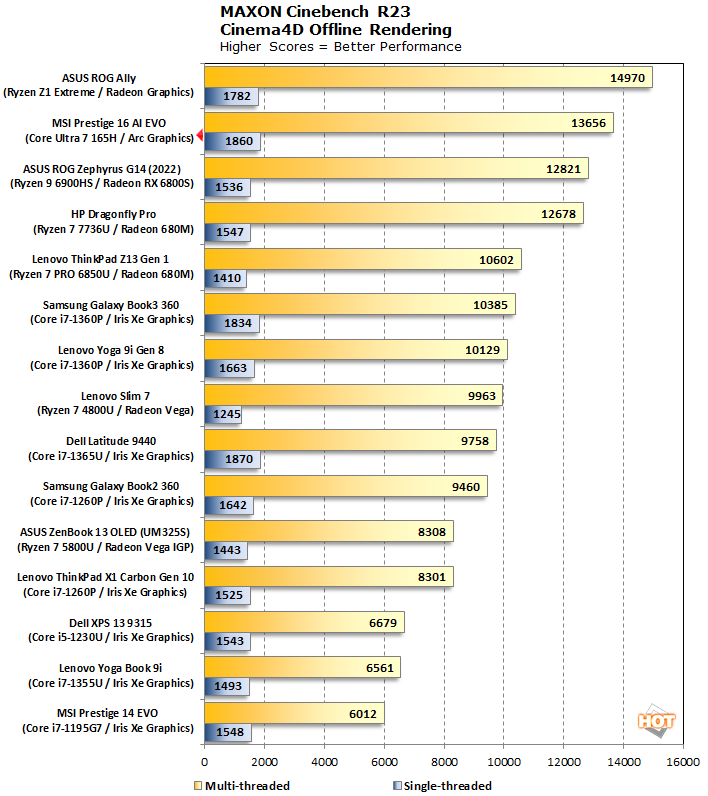
Another excellent result for the Core Ultra 7 165H. While the multi-core score doesn't quite match the unbridled power of eight Zen 4 CPU cores, the single-core score is nearly the highest in its weight class, and it soundly trounces its previous-generation predecessors. Cinebench R23 has always favored Zen, anyway. Let's see if that holds true in the next-gen version.
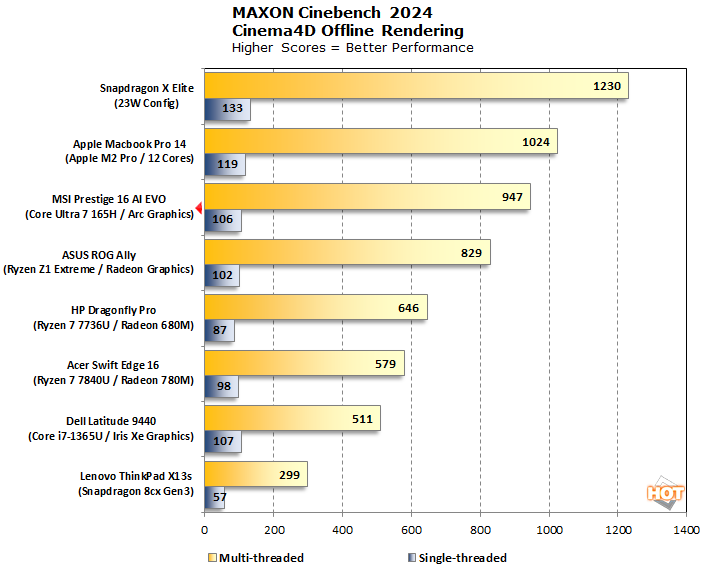
The tables turn in Cinebench 2024, where the Core Ultra 7 165H takes the top spot in its power class, at least for x86-64 CPUs. Apple's M2 Pro and Qualcomm's pre-release Snapdragon X Elite both run ahead, but bear in mind that we didn't get to run those Snapdragon benchmarks ourselves, and those parts won't be available until the middle of next year.
Geekbench System Benchmarks
Geekbench is a cross-platform benchmark that simulates real-world workloads in a wide variety of tasks, including encryption, image processing, physical simulation, machine learning, and many more. We tested the notebooks featured here with both the previous-generation Geekbench 5 (because we have a lot of test data), and with the latest Geekbench 6 version. First up, Geekbench 5:
It's another chart-topper for the Core Ultra 7 165H. Once again, this isn't the absolute fastest Geekbench 5 score we've seen, but it is definitely the fastest in this TDP class, and by quite a bit. The single-core score is impressive enough, but all those E-cores lend quite a lot of aid to the Core Ultra 7's multi-core performance. Geekbench 6 changes the way things are calculated, though; does the Core Ultra hold up?
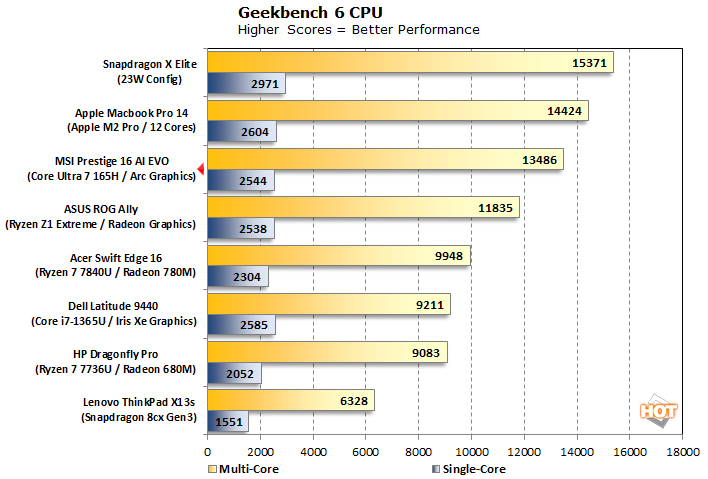
Yes it does. AMD's Phoenix-based Ryzen Z1 Extreme closes a little ground here, but it's still trailing the Prestige 16 AI Evo by a country mile in the multi-threaded test—to be expected when comparing an 8-core CPU to a 16-core unit. As with Cinebench 2024, Apple's M2 Pro and the Qualcomm Snapdragon X Elite run out ahead, though the gap is considerably smaller here. Check out the last-gen Core i7-1365U getting left in the dust.
PCMark10 Whole System Benchmarks
PCMark 10 uses a mix of actual real-world applications like Office and Zoom as well as simulated workloads to establish how well a given system performs productivity tasks, including but not limited to image and video editing, web browsing, teleconferencing, document editing, and so on. This chart can be confusing to look at, but the systems are sorted by the overall PCMark score, which is the yellow bar at the top of each entry.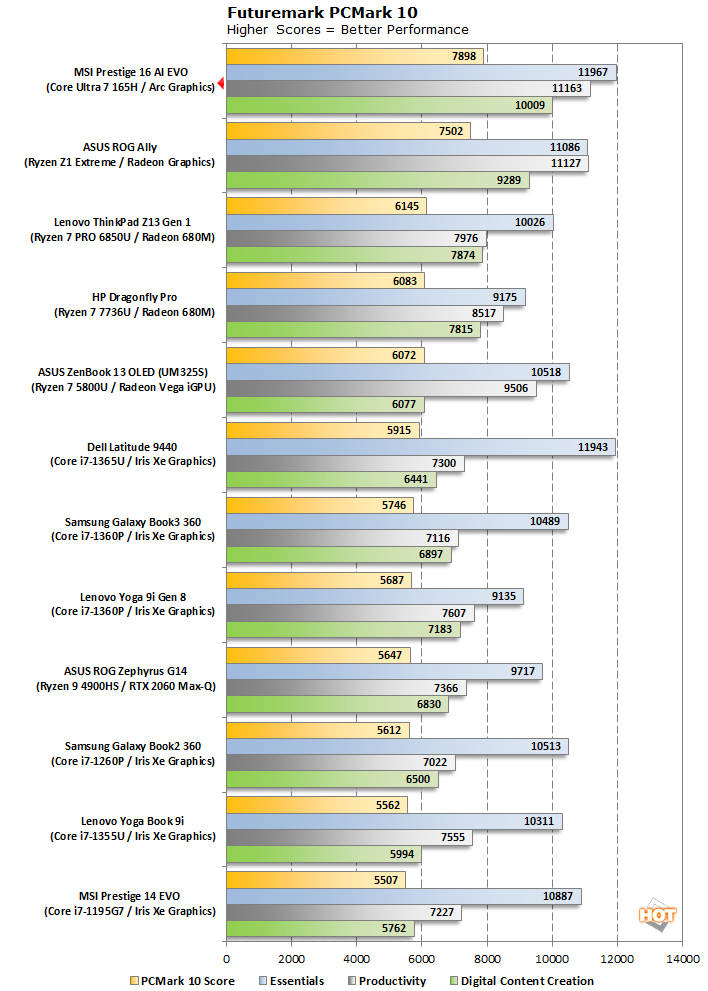
Another chart-topper for the Core Ultra 7 165H, although only just so. It pulls out ahead of AMD's Phoenix-based Ryzen Z1 Extreme with outstanding performances in the Essentials and Digital Content Creation categories. Actually, all of these scores are fantastic, and at the risk of sounding like a broken record, these results put this machine into the company of mid-range gaming laptops and previous-generation desktops. In particular, the digital content creation score is exceptionally high for a machine with integrated graphics.
UL 3DMark Graphics and GPU Tests
If you're reading this text, you're almost assuredly already aware that 3DMark has a wide variety of tests available. Most of them aren't really suitable for a system like this, as it is decidedly not a gaming laptop. That doesn't mean it's incapable of playing games, though—in fact, quite far from it. We chose to run 3DMark Night Raid, a modern DirectX 12 test specifically for mobile parts and integrated graphics, as well as the extremely-demanding Fire Strike Extreme DirectX 11 benchmark. First up, Night Raid: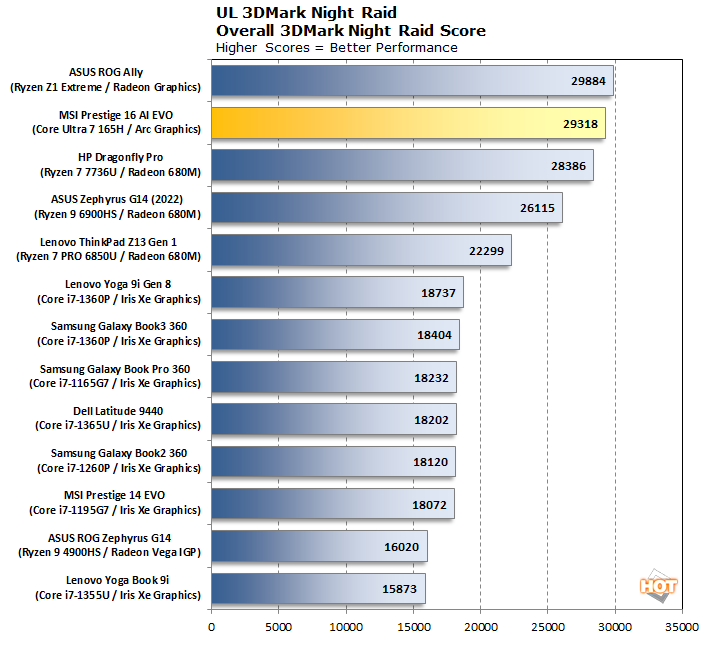
If you look at this result and are disappointed that the Core Ultra 7 165H loses out to the Ryzen Z1 Extreme, you are missing the point. This machine has a lower TDP (at 28W instead of 30W) and much slower memory at 5600 MT/s instead of 6400 MT/s. It's also using an Arc GPU, not a Radeon. Now, assuredly 3DMark is one of the most-optimized workloads in any graphics driver, but what is essentially performance parity with a powerful gaming-focused Radeon GPU in this benchmark is an amazing result for Intel. Note that this result is nearly double the last-gen Core i7-1360P with the same TDP.
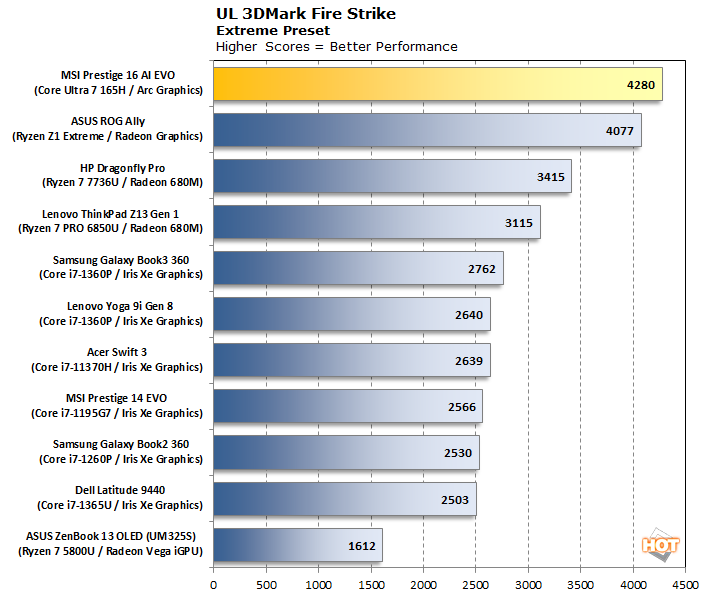
Indeed, in 3DMark Fire Strike, things turn around for Intel. This result is likely down to the fact that the Arc GPU built into the Core Ultra 7 165H is actually a full 33% larger (in terms of compute resources) and 10% faster (in terms of clock rate) than the RDNA 3 Radeon built into the Ryzen Z1 Extreme. Full disclosure, this high-resolution test doesn't really present playable performance for any of these integrated GPUs, but if we had to pick one, it would assuredly be the Arc GPU in the Core Ultra 7 165H.
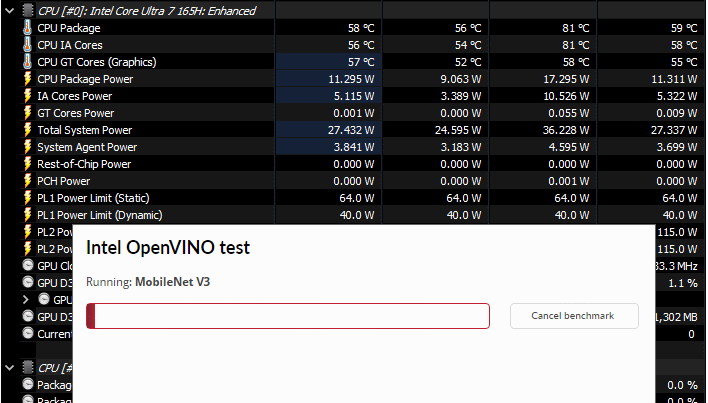
UL Procyon AI Inference Benchmarks
There's a lot to talk about with the Core Ultra CPUs. Their tiled nature, the big fast GPU, the insane power efficiency that we'll talk about soon, and of course, the brand-new NPU. The idea of "edge AI", or running AI workloads natively on your local hardware instead of in the cloud, is only really emerging into the mainstream on PCs. As such, benchmarks for these workloads aren't exactly prolific. Fortunately, UL has already built one into its Procyon benchmark suite. Let's take a look at how a few machines do: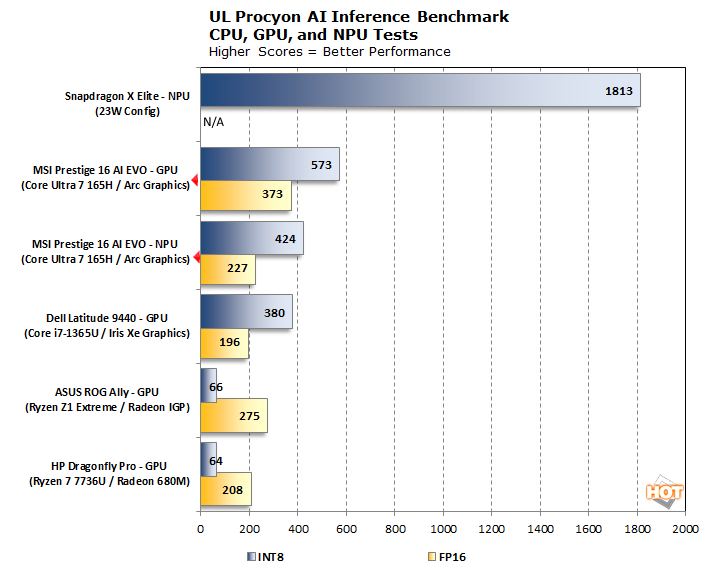
The Snapdragon X Elite's dominating performance kind of throws off the scale a bit, but remember the earlier disclaimer about how we didn't get to run those benchmarks ourselves (though we did witness them live and in-person); that's also why we don't have FP16 data for that part. So, to put things in perspective, the Core Ultra 7 165H's GPU is 35% faster than the Ryzen Z1 Extreme's Radeon part even when doing a like-for-like FP16 test. Flipping over to the INT8 format—not natively supported by the Z1's Radeon IGP—the Core Ultra 7 165H's Arc GPU turns in a very impressive score of 573. But what about the NPU?
We wanted to run more AI benchmarks, and we may yet do so, but we haven't had much luck with getting results that are both repeatable and quantifiable from many AI workloads. We're looking at Stable Diffusion image generation and some Adobe studio effects, and we may produce a second post with those numbers for folks that are curious.
Gears Tactics DirectX 12 Gaming Benchmarks
Gears Tactics, released in 2020, still makes an excellent benchmark for integrated hardware like this. It's a tightly-optimized Unreal Engine title with a highly-configurable built-in benchmark that provides a wealth of performance data after each run. We tested it on High, Medium, and Low presets at 1080p resolution.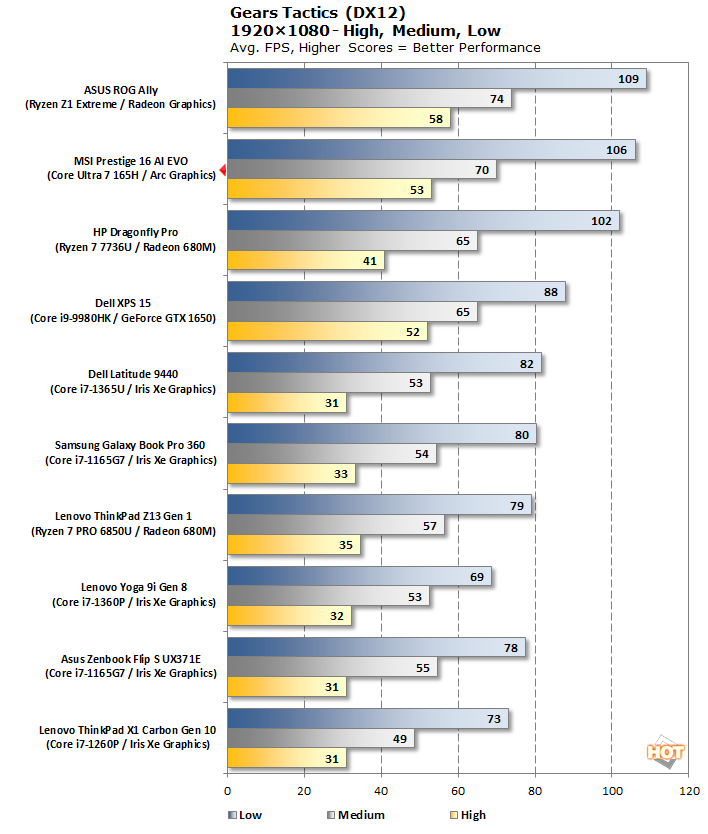
Middle-earth: Shadow of War DirectX 11 Gaming Benchmarks
Shadow of War is a few years older still compared to Gears Tactics, but it was a real system smasher when it launched, and that means it still makes a great benchmark in 2023. Another highly-configurable title, this game has a detailed in-game benchmark that renders a flyby through an orc encampment and into a massive city. We test in native 1080p resolution on the "High" graphics preset, which is a pretty challenging workload for most IGPs.
Well, there it is. Another neck-and-neck performance with the much more gaming-focused Ryzen Z1 Extreme. This is an excellent result; the game is perfectly playable at these settings, and it honestly looks great. No complaints here; ME:SOW runs great on this machine, and if you really must have that locked 60 FPS, you can use resolution scaling to bump it down a few notches.
So, it benchmarks well, taking the top or a near-top place in every single test. How about battery life, though? Head over to the final page to find out...


