Gigabyte AERO 16 OLED Review: Solid Performer, Stunning Design
Gigabyte AERO 16 OLED: System Performance, Gaming and Graphics Benchmarks

It's pretty obvious we like how Gigabyte built and designed the AERO 16 OLED, especially that OLED display, but that won't mean much if the computer can't keep up with graphically intense workloads. All tests were run with the latest NVIDIA Studio driver installed, since that's more common for this type of computer rather than the Game Ready driver, and both the BIOS and Windows 11 Pro were updated prior to testing.
The user mode was set to Power for all of our testing, although we did try switching the computer's fan mode into "Turbo" for a few tests to see if there was any significant performance uplift. Unsurprisingly, there wasn't much of a difference, so we left those results out of the charts to minimize clutter. Finally, the battery tests were run in both Intel and NVIDIA graphics output modes, to see if there was a battery penalty to running the display off of the discrete GPU.
ATTO Disk Benchmark
ATTO Disk measures read/write bandwidth and IOPS for a bunch of different data sizes ranging from 512 bytes up to 64MB, and it's a quick way to check if the NVMe drive in your system is performing at the level you would expect given the spec. For a PCIe Gen 4.0 drive we'd expect to peak around 4-6GB/s writes and 5-6GB/s reads, and clock around 100K IOPS for the smallest data sizes.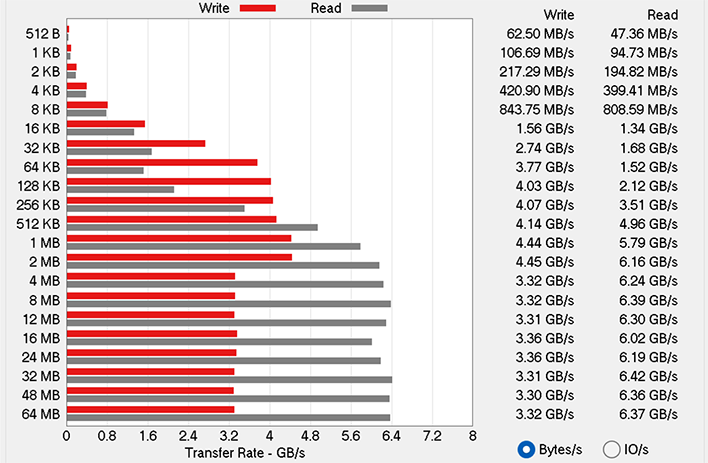
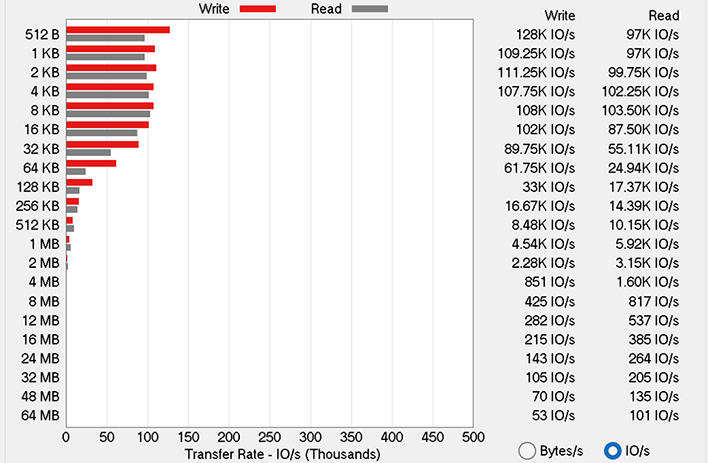
The AERO 16 OLED puts in a solid performance here. Maximum sequential read speeds are very snappy at over 6GB/s and IOPS are pretty impressive as well. The only head scratcher is the write speed, which peak just below 4.5GB/s before plateauing at around 3.3GB/s. That's a little slower than we typically see from similar drives.
Speedometer Browser Benchmark
To test web app performance, we use BrowserBench.org's Speedometer benchmark, which loads and runs a bunch of sample web applications built on a range of development frameworks. It should give us a good sense of overall web app performance across all sorts of different applications.One important note: the scores on this benchmark are going to be affected by both the computer's hardware and any optimizations that may have been made to your browser of choice. We always run this test on the latest version of Chrome, so to limit the results in the chart to the most relevant comparisons we've removed any laptops that were tested before March of this year. However, there's probably still some score creep due to Chrome updates in the meantime.
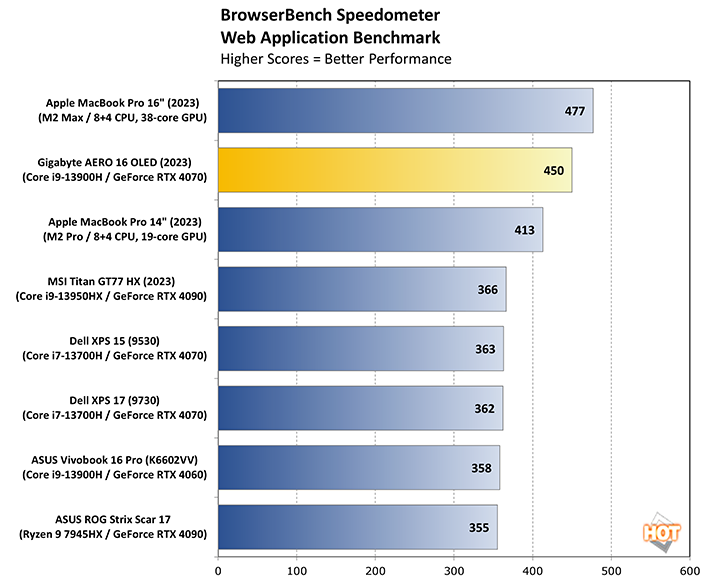
As you can see, the AERO does exceptionally well. We don't typically mix results from Macs and PCs, but the only other laptops we've tested that have broken the 400 point barrier are Apple's latest MacBook Pro 16 with M2 Max and MacBook Pro 14 with M2 Pro. The Gigabyte AERO 16 joins this exclusive (for now) club with a score of 450 runs per minute. Compared this to our recent results from the XPS 17 and it should give you a sense of the performance you gain by stepping up from a Core i7-13700H to the Core i9-13900H in this machine.
Cinebench R23 Benchmark
Moving on to something a bit more stable across laptop generations, Cinebench R23 tests CPU rendering performance using the Cinema 4D R23 rendering engine. We test both single-core and multi-core performance, and a higher score is better.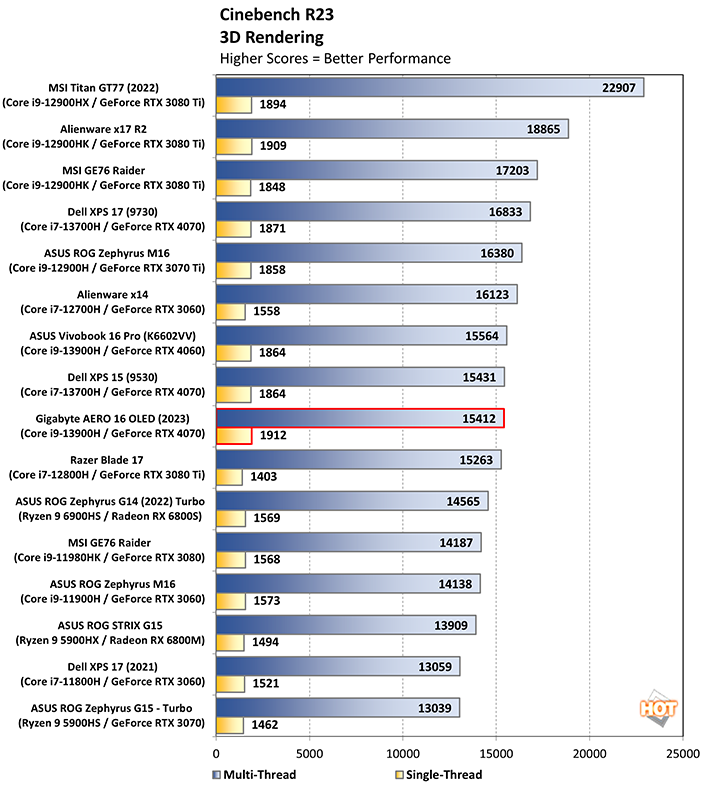
Surprisingly the AERO puts in slightly weaker performance than we were expecting in Cinebench, with multi-core performance falling short of the XPS 17 and XPS 15, both of which feature a less powerful CPU. Of course, "less powerful" also means "less heat", so it's possible we're running into some thermal limitations here since the AERO does not feature vapor chamber cooling, but we didn't see a significant difference by switching the computer into "Turbo" fan mode. Single core performance, on the other hand is much more competitive, outperforming every other notebook on the chart.
Geekbench 5 Benchmark
Another classic single- and multi-core benchmark, Geekbench tests the computer on a more varied set of tasks including image processing, PDF rendering, physics simulations and more. The question here is whether or not the pattern from Cinebench holds and we see better multi-core performance from less expensive (but possibly better cooled) hardware.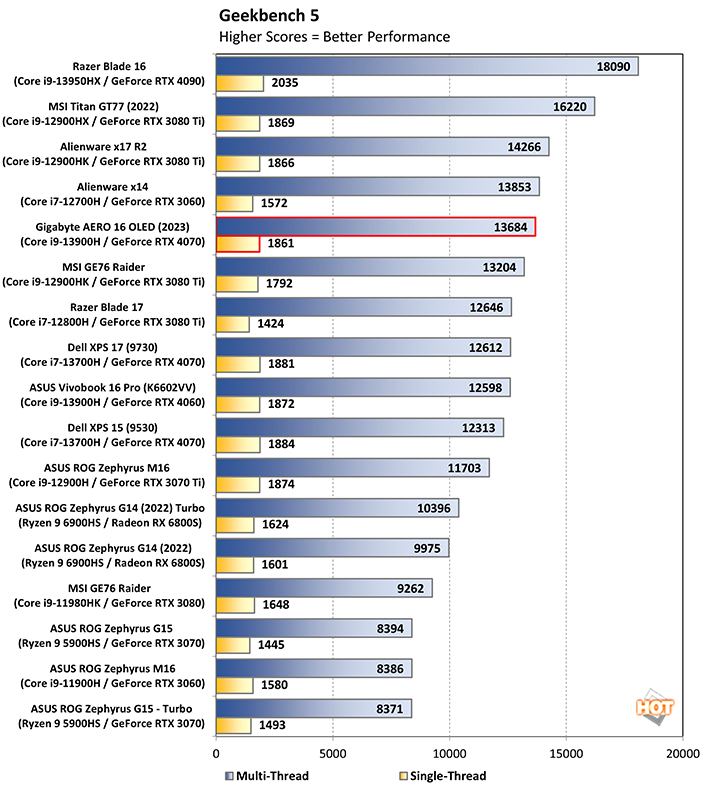
When it comes to a more varied set of workloads that don't stress the CPU for nearly as long, the Gigabyte AERO 16 OLED does just fine and we see it rise through the ranks, outperforming the XPS 15 and XPS 17, as well as the Vivobook 16 Pro that uses the same CPU. This is a good reminder of why one benchmark can't possibly tell the whole story.
If your primary workflow involves long-running CPU intensive tasks like exporting hundreds of heavily edited image files in Lightroom, it's worth keeping these results in mind.
PCMark 10 Whole System Benchmarks
Moving on to another varied test of the system's capabilities, PCMark 10 breaks out its testing into Essentials, Productivity, and Digital Content Creation categories that test different kinds of workloads. Essentials tests day-to-day workloads like web browsing and video conferencing, Productivity measures office applications like spreadsheet and document creation, and the DCC category tests photo and video creation and editing workloads.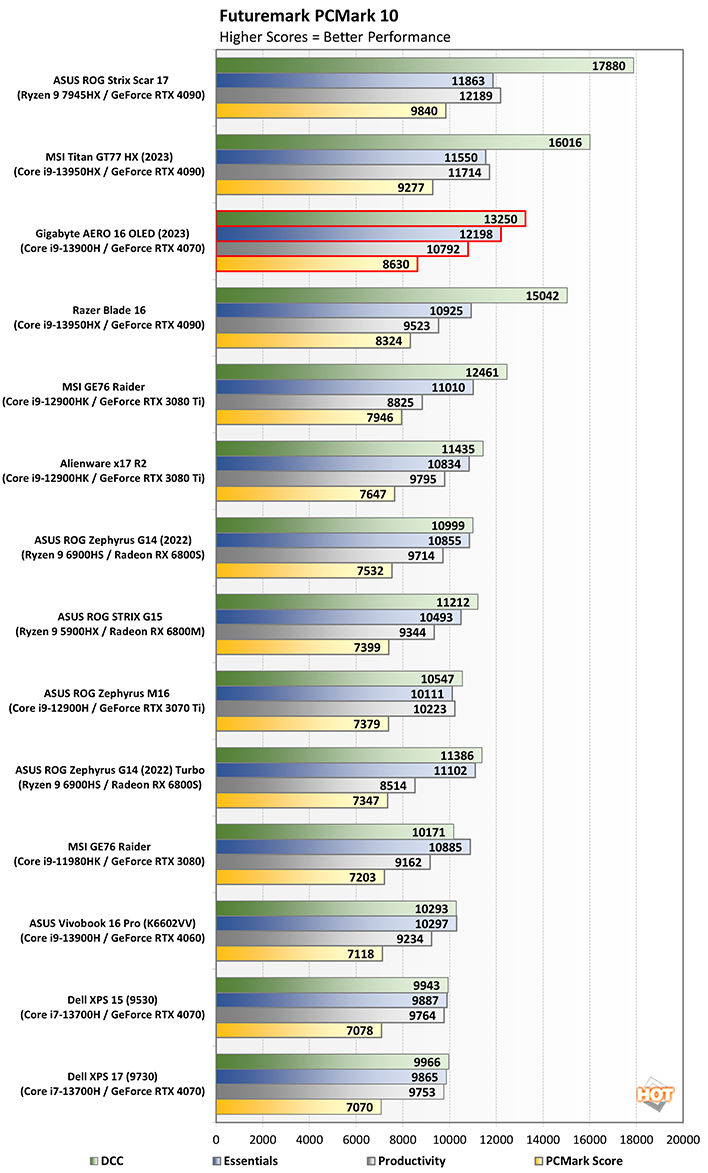
The AERO's overall score is quite high here, performing on par with more powerful and expensive machines like the Razer Blade 16 and leaving more similar laptops like the Vivobook 16 Pro and Dell XPS 17 in the dust. But it's worth looking closely at the category scores.
For the lower-intensity workloads in the Essentials and Productivity test groups that rely more heavily on single-core performance and won't stress the cooling system as much, the AERO puts in some impressive scores. The Essentials score is the highest on this chart. But in Digital Content Creation where both the CPU and GPU are being stressed more heavily, it falls closer to the other non-gaming laptops. Still, an extremely impressive performance across the board for a laptop that's still quite portable.
3DMark Graphics and GPU Benchmarks
Now we finally get into some of the GPU-intensive benchmarks that should really let the AERO 16, with its 115W NVIDIA RTX 4070, shine when compared to some other non-gaming laptops that throttle that GPU down to just 60W (the Dell XPS 17) or even 40W (the Dell XPS 15). It's also worth glancing at the scores when compared against last year's gaming laptops with RTX 30-series graphics, since you can now pick up many of these notebooks at a discount.Starting out with Time Spy, let's see how the AERO 16 OLED copes with a substantial DX12 workload:
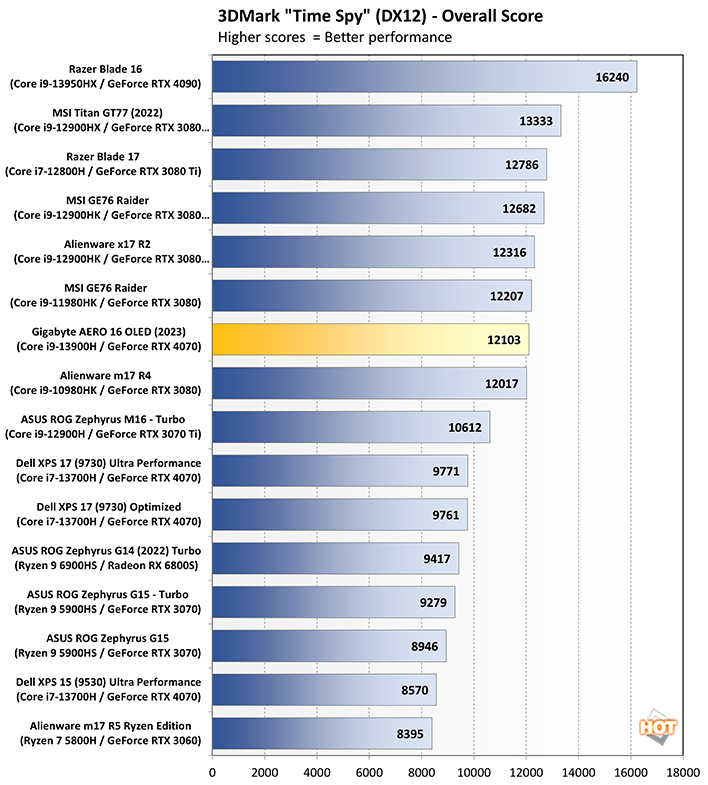
The Gigabyte AERO 16 OLED handled Time Spy quite well. You can see the benefits of additional wattage immediately. Despite using the "same" GPU as the XPS 17 and XPS 15, it easily bests both laptops without even needing to engage the Turbo mode.
Moving on to Fire Strike Extreme, this DX11 test is a bit more dated but can still pose a significant challenge for a laptop GPU that's starved for cooling capacity.
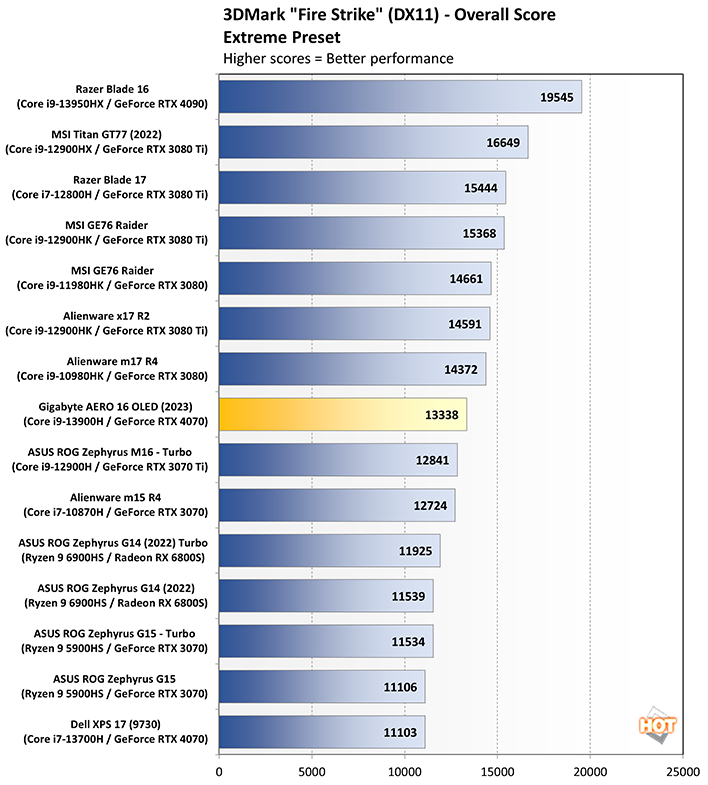
Unsurprisingly, the AERO falls a bit further behind last year's gaming behemoths in this test, but not by much. When you consider that the AERO 16 is relying on a 115W RTX 4070 in a relatively thin and light chassis, while the Alienware x17 R2 is using a more powerful RTX 3080Ti that's allowed to soak up a full 175W, you have to give NVIDIA credit for their generational efficiency gains.
Finally, for those of you who want to use this gorgeous display to play some ray-traced games, the Port Royal benchmark takes us back to DX12, this time with DirectX Ray Tracing (DXR) enabled.
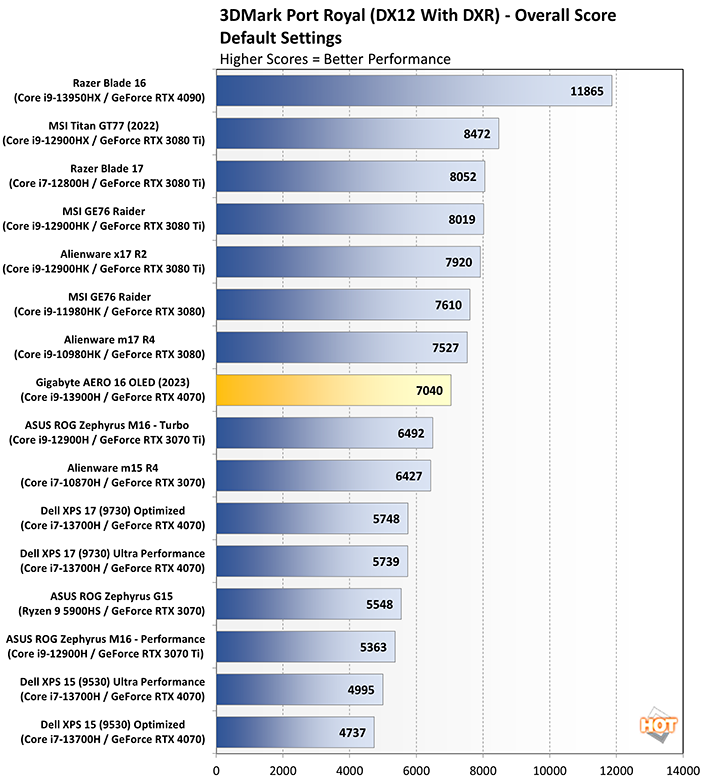
Again we're looking at a very strong performance that keeps up with or outright outperforms hefty gaming laptops from last year. The XPS 17 is again left in the dust, and the AERO even manages to outperform last year's ASUS ROG Zephyrus M16. Nothing here is surprising, but it's a good reminder that "RTX 4070 laptop" can mean different things depending on how much power that GPU is actually able to draw. At 115W the Gigabyte AERO 16 OLED maxes out what's possible from NVIDIA's 4070 laptop GPU, and that approach pays dividends in performance.
Shadow of the Tomb Raider Benchmark
Just because this is a creator PC with a 4K, 60Hz display doesn't mean you can't use it for gaming. If anything, the ultra-fast pixel response times of an OLED display make this a great gaming laptop if raw refresh rate isn't your be-all end-all. To that end, we ran some of our usual gaming benchmarks, starting with Shadow of the Tomb Raider.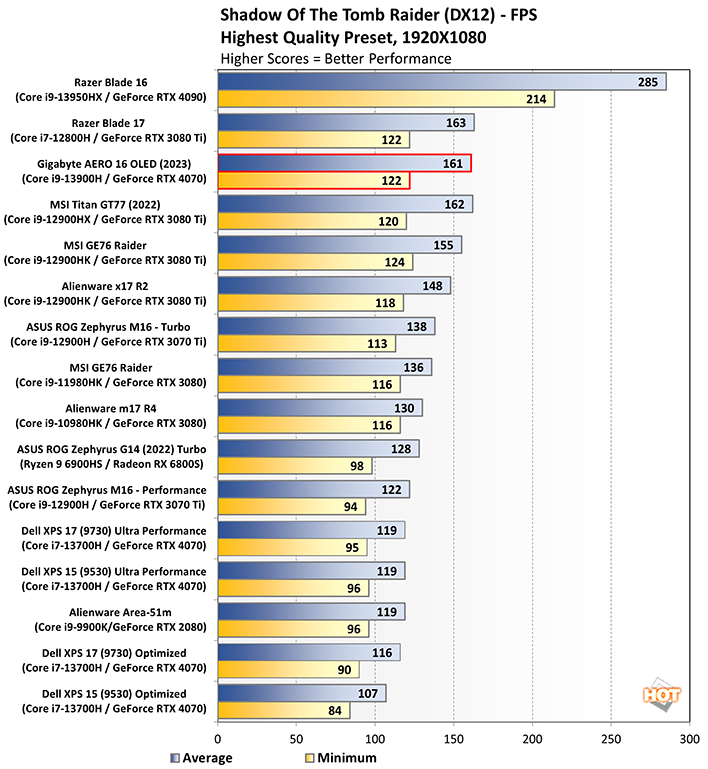
At 1080p with graphics set to the "Highest" preset and anti-aliasing turned off, the AERO puts in an incredibly impressive performance. Frame rates are neck-and-neck with last year's MSI Titan GT77 and Razer Blade 17, and because it's minimally GPU bound, it leaves the two Dell XPS computers to languish at the bottom of the list. With minimums that clock in at twice the display's refresh rate, you won't have any issues running this game smoothly at 1080p, and could probably crank up the resolution to QHD just fine.
Middle Earth: Shadow of War Benchmark
Stepping back to a DX11 title, Middle Earth: Shadow of War is a great fantasy title for fans of Tolkien's Lord of the Rings. As with Shadow of the Tomb Raider, we set the resolution to 1080p and graphics settings to the "High" preset before running the built-in benchmark to see how smoothly the laptop can render this game.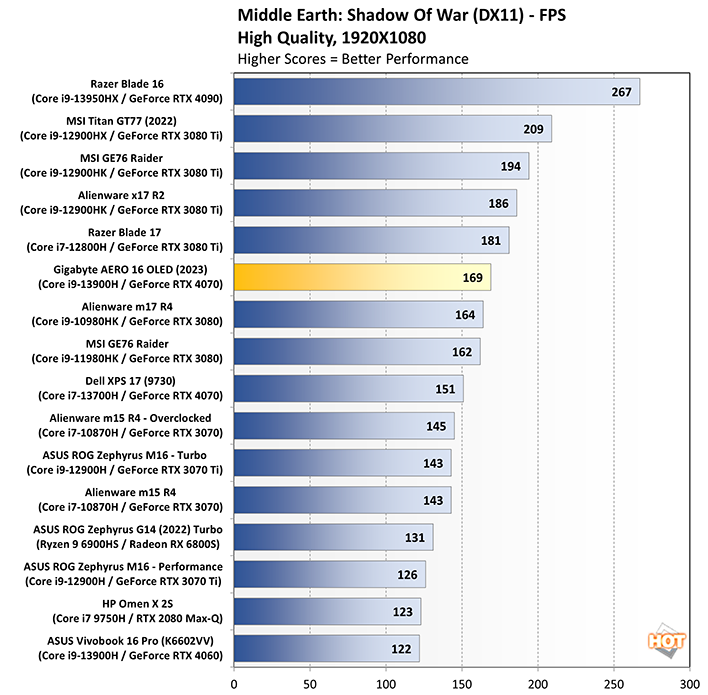
Again, we're well beyond what the display can reproduce, with an average frame rate of 169fps. However, it is worth noting that the range from minimum to maximum is much larger in this game with 33fps at the low end and 423fps at the high end. Fortunately that's all still very playable and, again, we see the AERO putting up numbers that are similar to much more powerful laptops from last year.
F1 2021 Benchmark
With support for DX12 and Ray Tracing turned on, the F1 2021 should present a bit more of a challenge. Resolution was again set to 1080p, with the graphics preset on Ultra High which sets Ray Tracing Quality to Medium with both Ray Traced Reflections and Ray Traced Shadows turned On.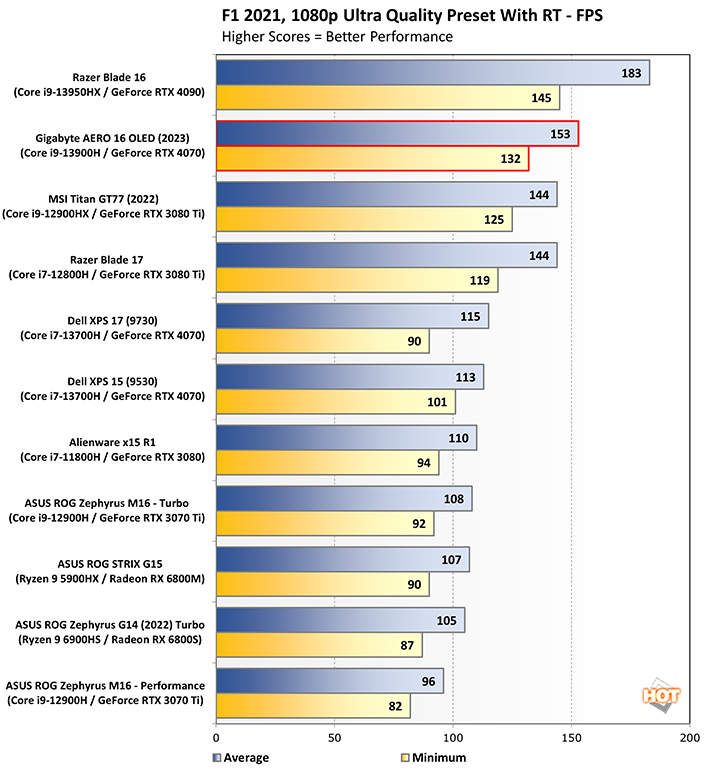
The RTX 4070 laptop GPU has significantly fewer ray tracing cores than RTX 3080Ti, and yet the AERO pulls out ahead of both the Razer Blade 17 and the older MSI Titan GT77. It can't match the RTX 4090 in this year's Razer Blade 16, but this 115W 4070 continues to impress. And if you're wondering how many frames you gain by upping the wattage from 60W to 115W on the same GPU, the answer is a whopping 33% uplift over the XPS 17.


