Dell Inspiron 16 Plus Laptop Review: Understated Beauty And Brawn
Dell Inspiron 16 Plus (7630): CPU, Browser And Full System Performance

We're fans of the looks and price of the Dell Inspiron 16 Plus (7630), but none of that matters if it lets us down on the performance front. To test that, we ran Windows Update and Dell Update until there were no more updates to install, and then grabbed the latest GeForce drivers from NVIDIA's website. This is the best way to test the current state of performance, replicating what buyers can expect out of the box, but after updating. Every benchmark enjoyed a minimum of three runs, with the median result reported here.
We used both Optimized and Ultra Performance modes for each of them, but in our CPU-only tests it didn't really make any sort of impact. To keep the charts as clean as possible and only report meaningful data, our non-3D and gaming benchmarks will only have the Optimized results. Those high-power benchmarks will show both Optimized and Ultra Performance. Ultra Performance is really about maintaining higher boost clocks for longer, which might be why it helped more in the gaming tests; most of our other tests are relatively short, even with three runs.
Dell Inspiron 16 Plus (7630) System Benchmarks
ATTO Disk measures read/write bandwidth and IOPS for a bunch of different data sizes ranging from 512 bytes up to 64MB, and it's a quick way to check if the NVMe drive in your system is performing at the level you would expect given the spec. For a PCIe Gen 4.0 drive we'd expect to peak around 4-6GB/s writes and 5-6GB/s reads, and clock around 100K IOPS for the smallest data sizes.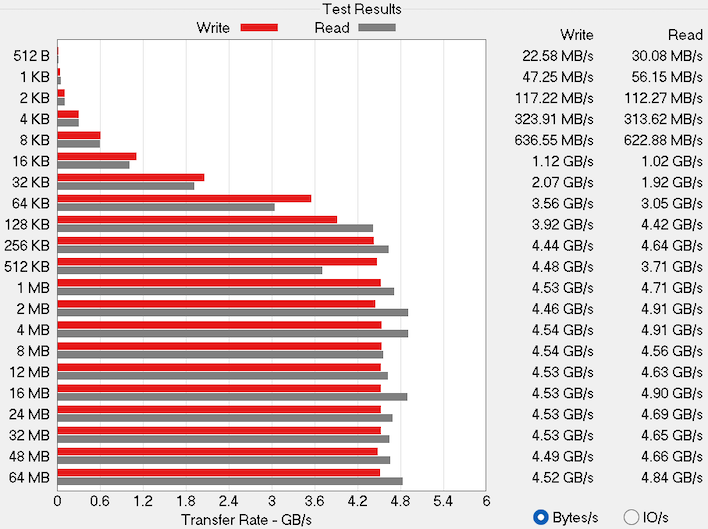
The Inspiron 16 Plus comes with a SK Hynix NVMe PCI Express SSD, which is relatively speedy in this quick-and-dirty benchmark, offering up sequential reads and writes that top 4.5 GB per second. While it's not the fastest we've ever seen, it's impressively quick given the price of the machine.
To test web app performance, we use BrowserBench.org's Speedometer benchmark, which loads and runs a bunch of sample web applications built on a range of development frameworks. It should give us a good sense of overall web app performance across all sorts of different applications.
One important note: the scores on this benchmark are going to be affected by both the computer's hardware and any optimizations that may have been made to your browser of choice. We always run this test on the latest version of Chrome. To limit the results in the chart to the most relevant comparisons we've removed any laptops that were tested before March of this year. However, there's probably still some score creep due to Chrome updates in the meantime.
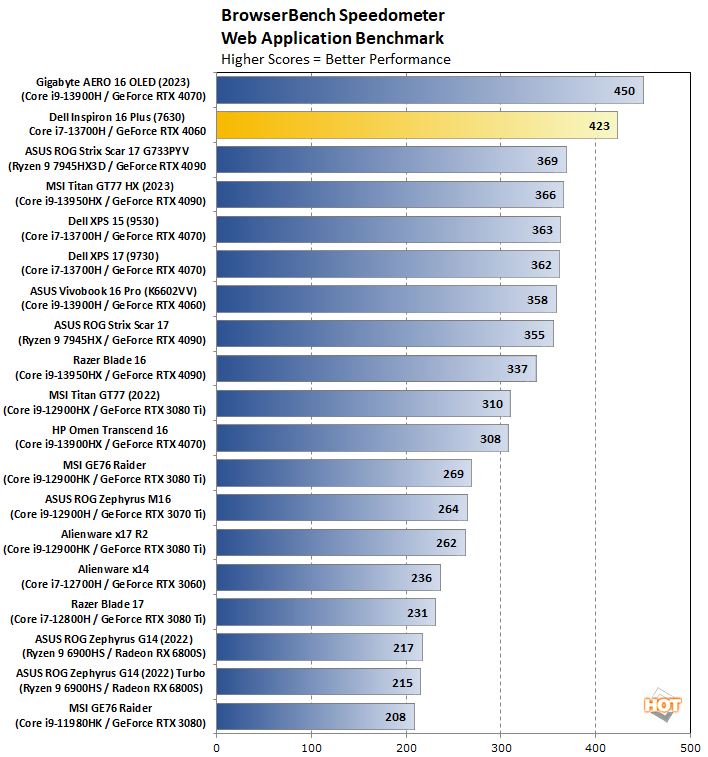
This chart here kind of shows what we mean about browser optimizations. The Core i7-13700H is not magic and it's probably not faster than the Core i9-13950HX in the MSI Titan GT77 HX, but the Inspiron 16 Plus turned in one of the very highest scores we've achieved here and by a wide margin. We think it's safe to say that it will provide a very good browsing experience that should be pretty much free from lag, even in heavy web applications.
Next up is Cinebench R23, based on Maxon's Cinema 4D engine. This CPU-based rendering test is a great strain on both single-threaded and multi-threaded performance and puts some pressure on each laptop's individual cooling solution.
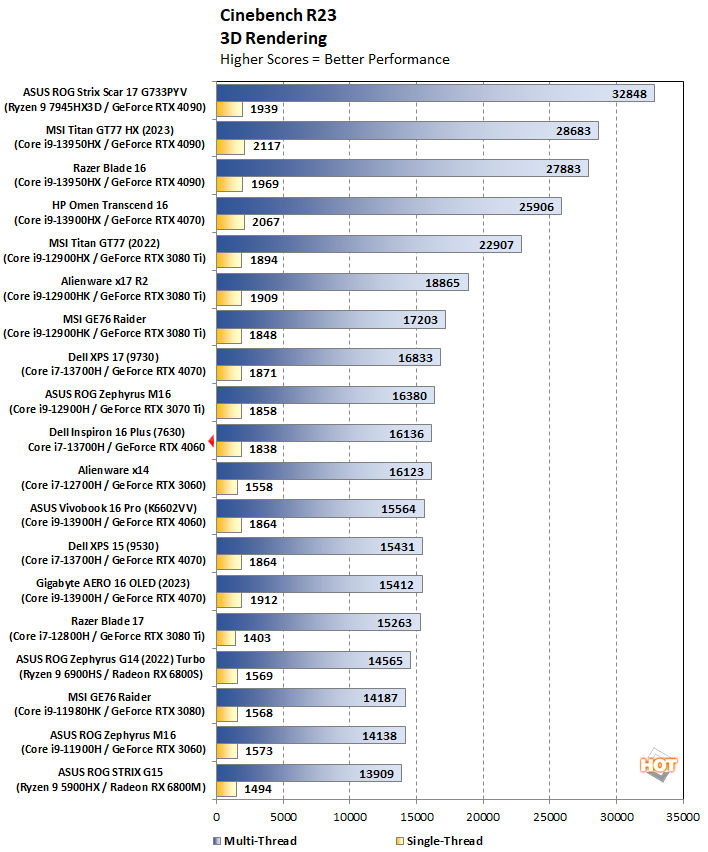
Performance here is more in line with our expectations. The Inspiron 16 Plus has really good single threaded performance in line with other 45-Watt CPUs like the Core i9-13900H found in the ASUS Vivobook 16 Pro that's part of NVIDIA's Laptops for STEM Students program. Multi-threaded performance also falls roughly where we'd expect, clustered in with other 14-core 20-thread Intel notebooks, like the aforementioned Vivobook. This is all very good news for our test unit.
Another classic single- and multi-core benchmark, Geekbench tests the computer on a more varied set of tasks including image processing, PDF rendering, physics simulations and more. The question here is whether or not the pattern from Cinebench holds and we see better multi-core performance from less expensive (but possibly better cooled) hardware.
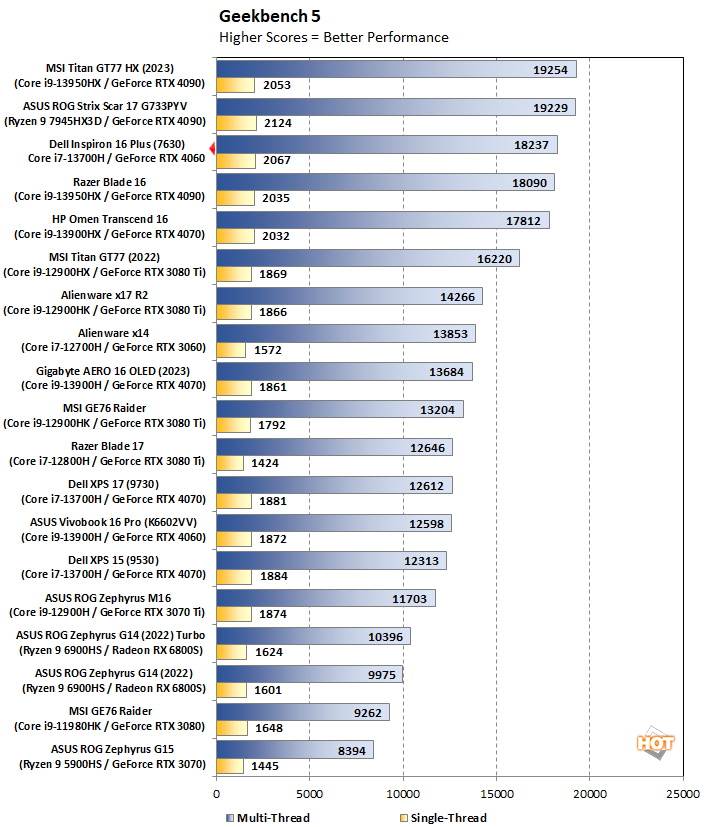
Geekbench 5 single-threaded performance is again right where we expect it, but it actually scores perhaps a little higher than we might expect in multi-threaded tests. However, this persisted across multiple runs -- part of why we do them in the first place -- and the data is what it is. It's a little strange to see the Inspiron score on par with the Razer Blade 16's Core i9-13950HX, but that's what Geekbench reported repeatedly.
PCMark 10 from UL is a whole-system test that pushes limits on a variety of productivity workloads. It breaks out its testing into Essentials, Productivity, and Digital Content Creation categories that test different kinds of workloads. Essentials tests day-to-day workloads like web browsing and video conferencing, Productivity measures office applications like spreadsheet and document creation, and the DCC category tests photo and video creation and editing workloads.
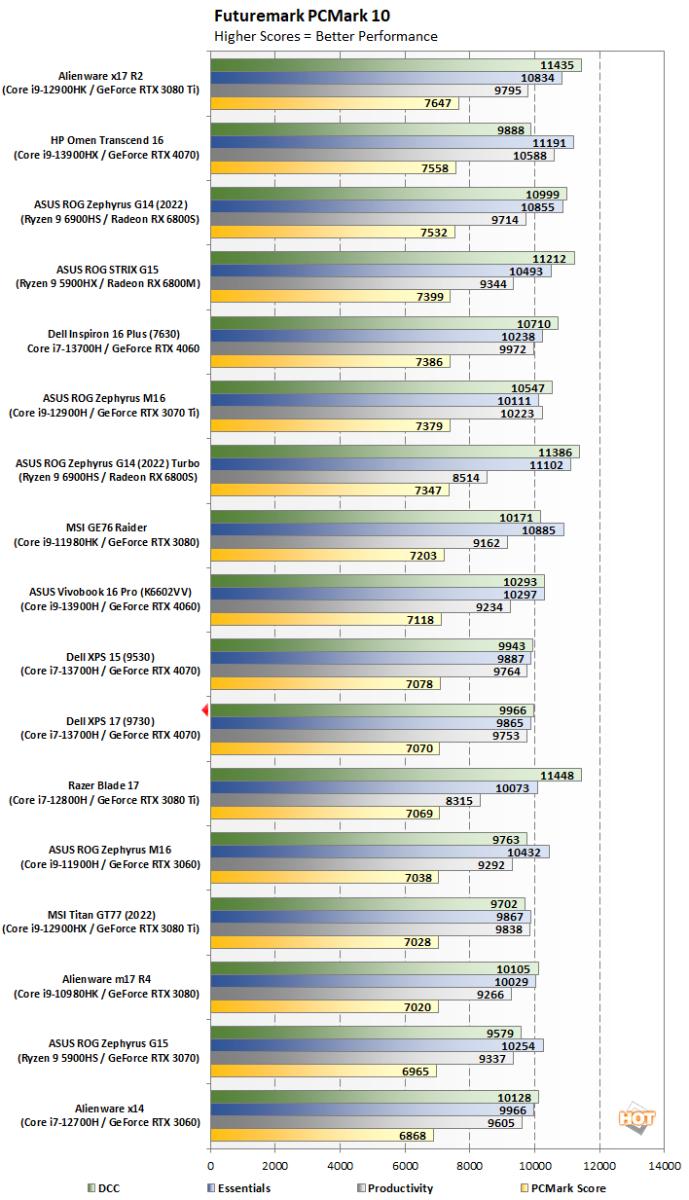
Here we're getting back to normal and the Inspiron 16 Plus scores right where we'd expect on this whole-system benchmark. The Dell XPS 15 (9530) has a 40-Watt GeForce RTX 4070 (rather than a higher-TGP, lower-tier card in the RTX 4060 here) and the exact same CPU. The two systems are essentially tied in every subtest.
Dell Inspiron 16 Plus (7630) 3D and Gaming Benchmarks
Now we finally get into some of the GPU-intensive benchmarks that should stretch the 60-Watt GeForce RTX 4060 GPU in the Inspiron 16 Plus. It's worth glancing at the scores when compared against last year's gaming laptops with RTX 30-series graphics, since you can now pick up many of these notebooks at a discount. Let's start with the DirectX 12-based Time Spy, which puts a substantial non-ray traced workload onto each laptop.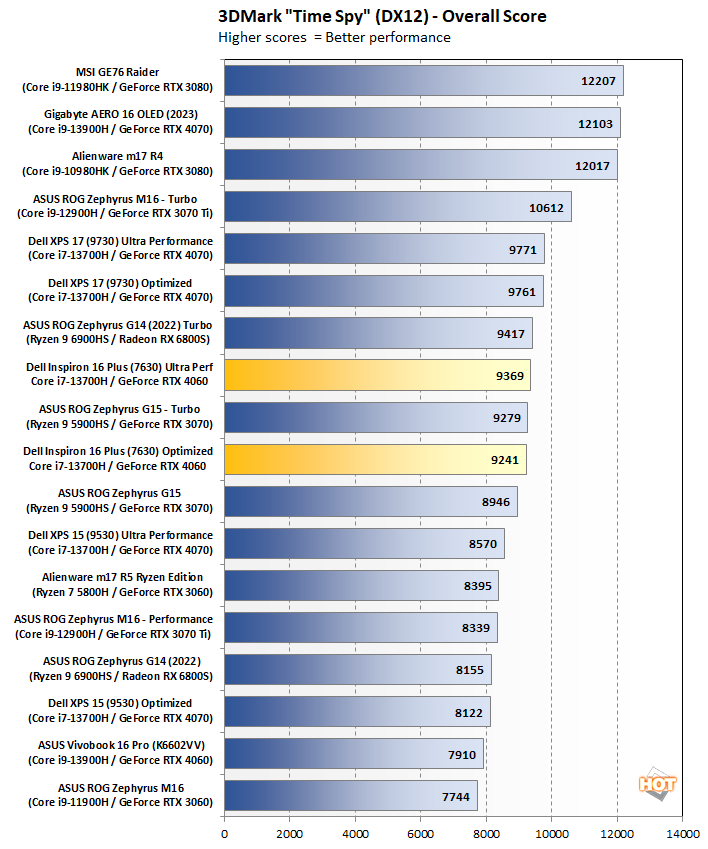
Here we're seeing the first test with Ultra Performance, and it didn't make a huge difference. However, we'll reserve judgment for actual games. Still, this notebook with its 60-Watt GeForce RTX 4060 did a pretty solid job with both performance profiles. It seems to saddle up next to systems with last-gen GeForce RTX 3070 graphics like the ROG Zephyrus G15 in Turbo mode, and comes within throwing distance of the larger Dell XPS 17 (9730) and its 60-Watt GeForce RTX 4070.
Moving on to Fire Strike Extreme, this DX11 test is a bit more dated but can still pose a significant challenge for a laptop GPU that's starved for cooling capacity.
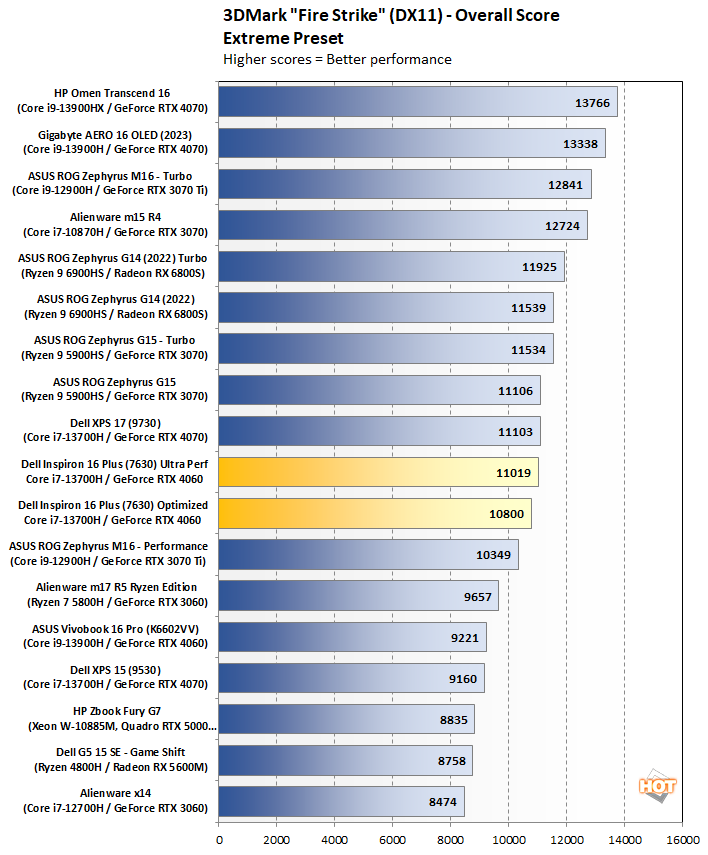
This is a lot of the same story as we saw in Time Spy. It's right in the middle of the pack, trailing high-power GPU systems like the Gigabyte Aero 16 OLED's 115 Watt GPU, but pulling ahead of the similarly-specced ASUS Vivobook 16 Pro.
Finally, the Port Royal benchmark takes us back to DX12, this time with DirectX Ray Tracing (DXR) enabled. This test shows off how ray tracing in real time can enhance graphics fidelity, while simultaneously illustrating just how demanding this feature can be.
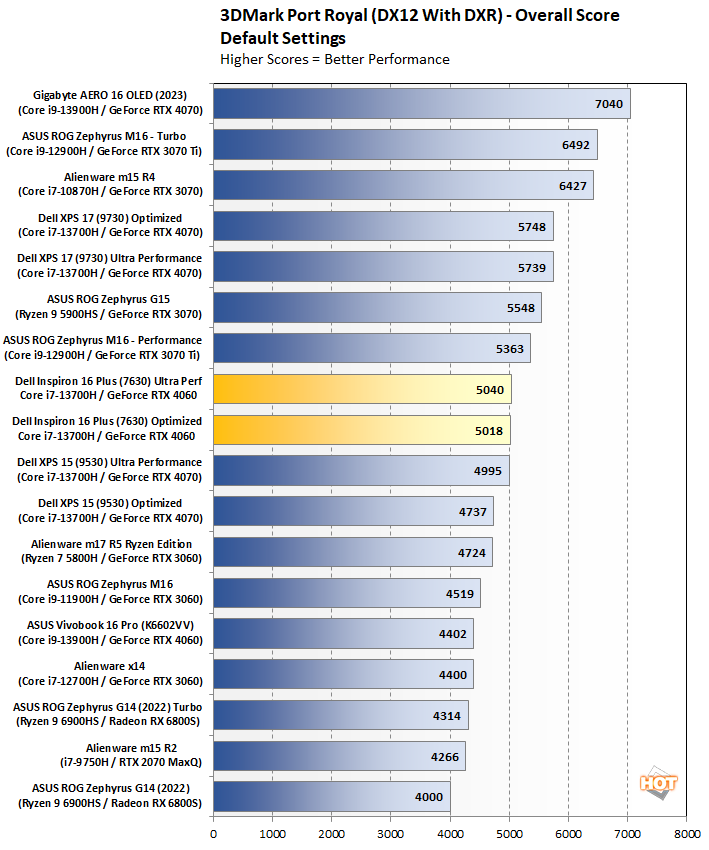
This test illustrates just how hard on a GPU that DirectX Ray Tracing can be. The higher-powered GPUs, in terms of total graphics power, tend to score higher regardless of generation. That's why the XPS 15 falls behind the Inspiron 16 Plus, and that's why the Alienware m15 R4 and its GeForce RTX 3070 score 50% higher.
A nice 1600p display with a 120 Hz refresh rate is just what the doctor ordered for gaming. While the Inspiron 16 Plus isn't specifically a gaming machine, we do expect to see some decent performance in real titles. We'll start off with the finale of the rebooted Tomb Raider trilogy, Shadow of the Tomb Raider.
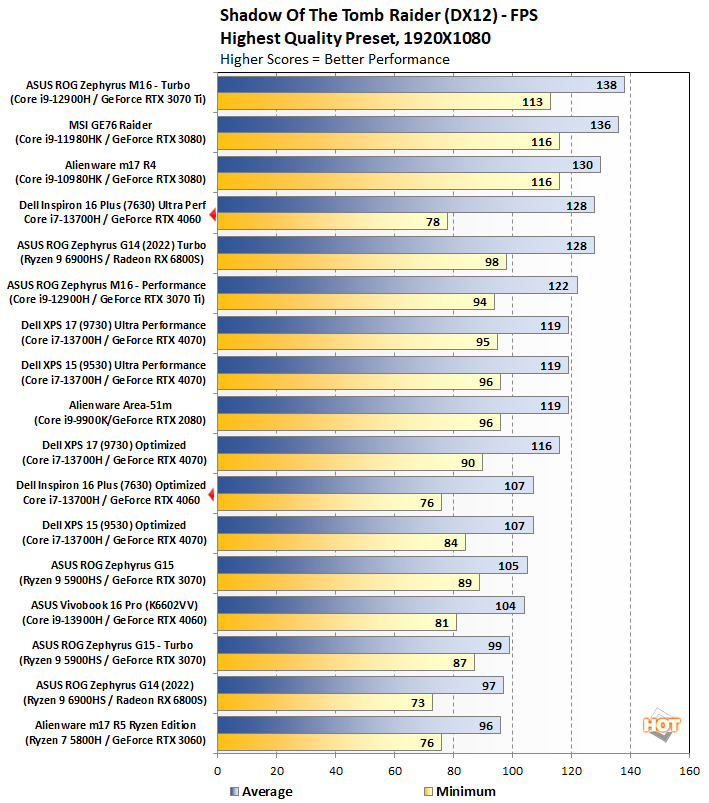
At 1080p we can start to separate the Optimized performance profile from the Ultra Performance option. While Ultra Performance has higher fan speeds and more noise, Shadow of the Tomb Raider ran about 10% faster this way. It keeps up with previous-generation kings like the MSI GE76 Raider and its GeFroce RTX 3080, in fact.
120+ frames per second in this title should also mean that it runs well at the panel's native resolution. 2560x1600 isn't something we typically test so we don't have comparative figures, but I can tell you this same test runs at 68 fps on Ultra Performance mode with a minimum frame rate reported at 54. There's DLSS on tap if you need more performance, too.
Stepping back to a DX11 title, Middle Earth: Shadow of War is a great fantasy title for fans of Tolkien's Lord of the Rings. As with Shadow of the Tomb Raider, we set the resolution to 1080p and graphics settings to the "High" preset before running the built-in benchmark to see how smoothly the laptop can render this game.
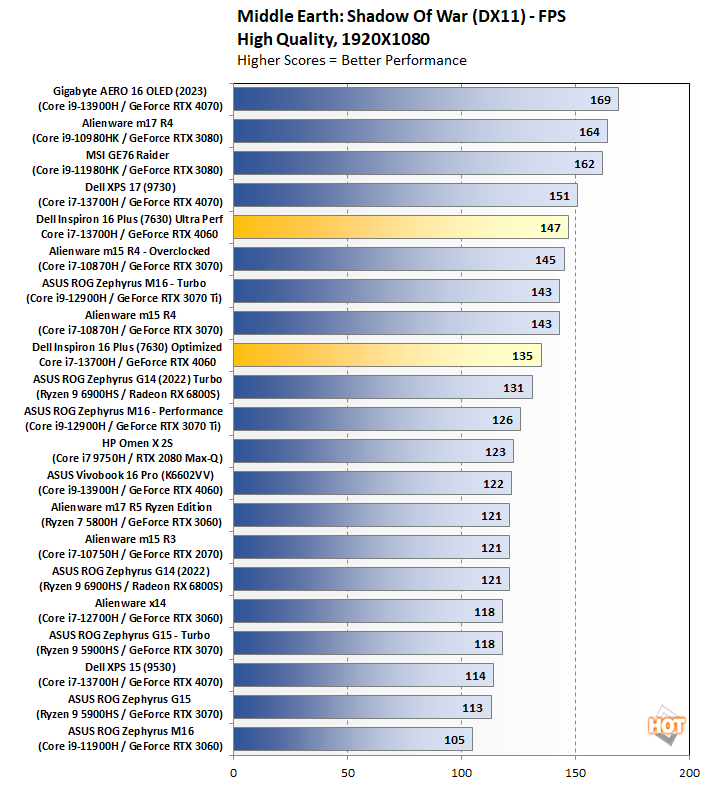
Once again we get close to 10% extra performance as a trade-off for some extra fan noise, and if we're playing with a headset that seems like a good decision. The 135+ frame rate here is actually faster than the panel goes, so VSync might save some power and noise, or there's again plenty of headroom to head up to 1600p.
With support for DX12 and Ray Tracing turned on, the F1 2021 should present a bit more of a challenge. Resolution was again set to 1080p, with the graphics preset on Ultra High which sets Ray Tracing Quality to Medium with both Ray Traced Reflections and Ray Traced Shadows turned On.
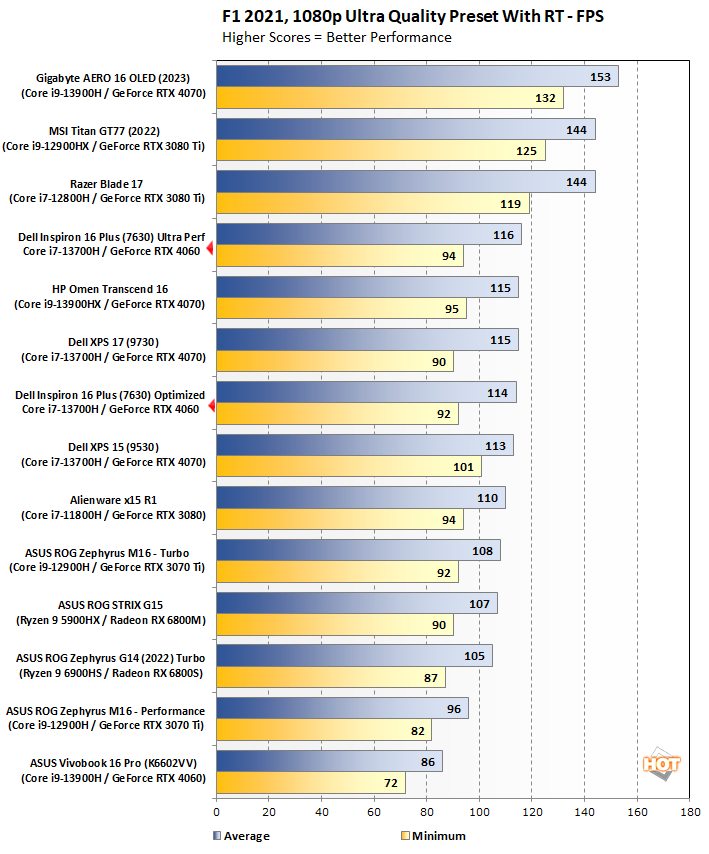
At 1080p, we see that even with ray tracing, performance is really, really good in F1 2021. It's ultra smooth on just about every system we've tested, but it's also surprisingly way ahead of the ASUS Vivobook 16 Pro, even in Optimized mode. It's also on par with the several GeForce RTX 4070 notebooks, including the HP Open Transcend 16.
Lastly, Marvel's Guardians of the Galaxy has some really great graphics including some ray traced reflections and shadows. We'd expect lower performance here, but again there's DLSS 2.0 to gain back some performance for those who don't find it to their liking.
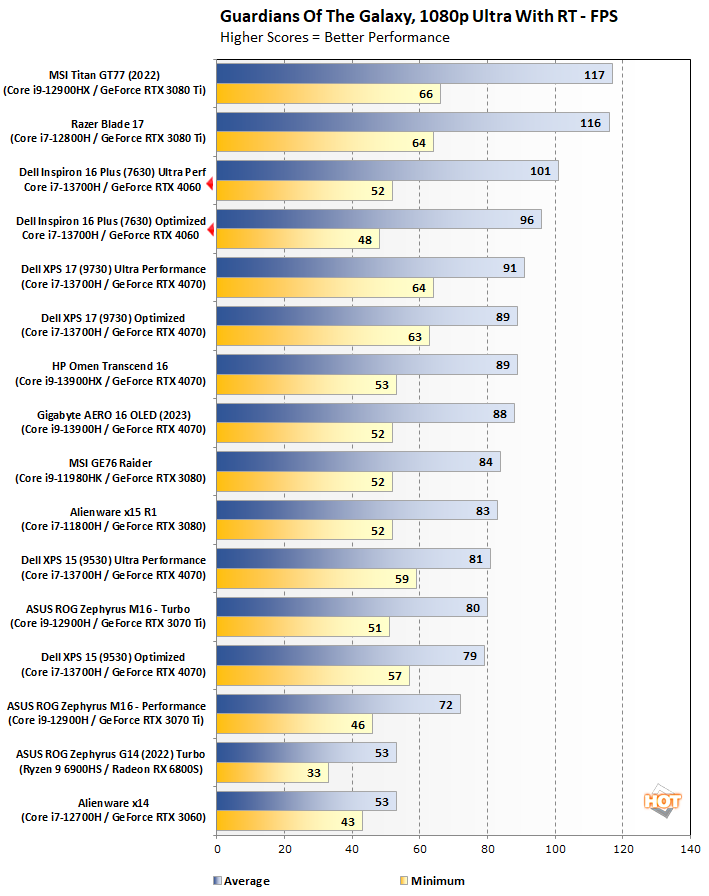
Once again the perplexing tale of the Inspiron 16 Plus's better-than-expected performance continues. We wouldn't have guessed this system would be faster than Dell's own XPS 17 (9730) and its 60-Watt GeForce RTX 4070 but here we are. The ordering does seem to indicate GPUs with higher power limits do better, much like 3DMark Port Royal, so maybe this is about ray tracing hardware stretching its legs. At any rate, 100 fps at 1080p is pretty good, and we can say that at 1600p with DLSS set to Quality, performance is very similar for full-resolution gaming goodness.
Next up we'll take a look at battery life, thermal performance, and round it out with our conclusions.


