Before running our selection of benchmarks, we apply the latest Windows and driver updates to the system we are testing (in this case, the ASUS ROG Zephyrus M16). Our system shipped with the Windows 10 21H1 update already applied. Other than that, we run all our tests with out-of-the-box settings. Our goal is to test the system as it ships, but after auto-updating, to accurately reflect what buyers can expect from a retail experience. The big comparison here to watch is with the Alienware m15 R5 Ryzen Edition, which has the 125 Watt version of the GeForce RTX 3060 rather than the Zephyrus's 80-100 W GPU. It also has one of AMD's fastest Zen 3 CPUs up against Tiger Lake-H in the Zephyrus.
 |
| ATTO Disk Benchmark |
| Peak Sequential Storage Throughput |
|
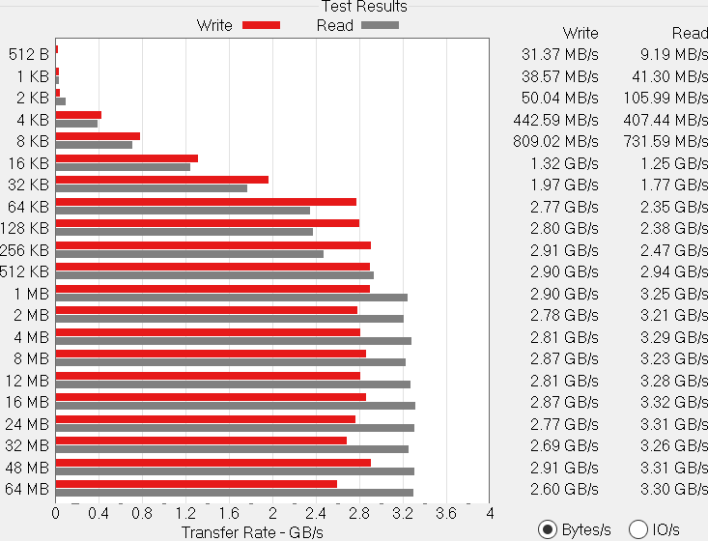
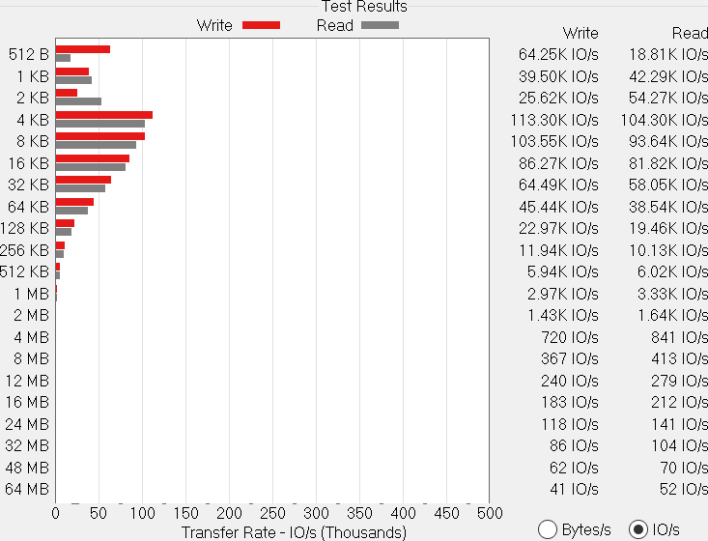
The
ATTO disk benchmark is a fairly quick and simple test which measures read/write bandwidth and IOPS across a range of different data sizes. While we don't typically compare these results across multiple machines, it's useful to gauge whether a particular notebook's storage subsystem can handle being put under pressure.
The ROG Zephyrus M16 shipped with an SK Hynix HFM001TD3JX013N, which ASUS says in its specifications is a PCI Express 4.0 drive. The bandwidth we measured with ATTO wasn't what we've come to expect from PCIe 4.0 drives, however. Still, it's not like performance was bad at all. Reads and writes maxed out at around 3.5 GB per second, and IO performance was about where it should be.
 |
| Speedometer Web Application Benchmark |
| Browser Performance |
|
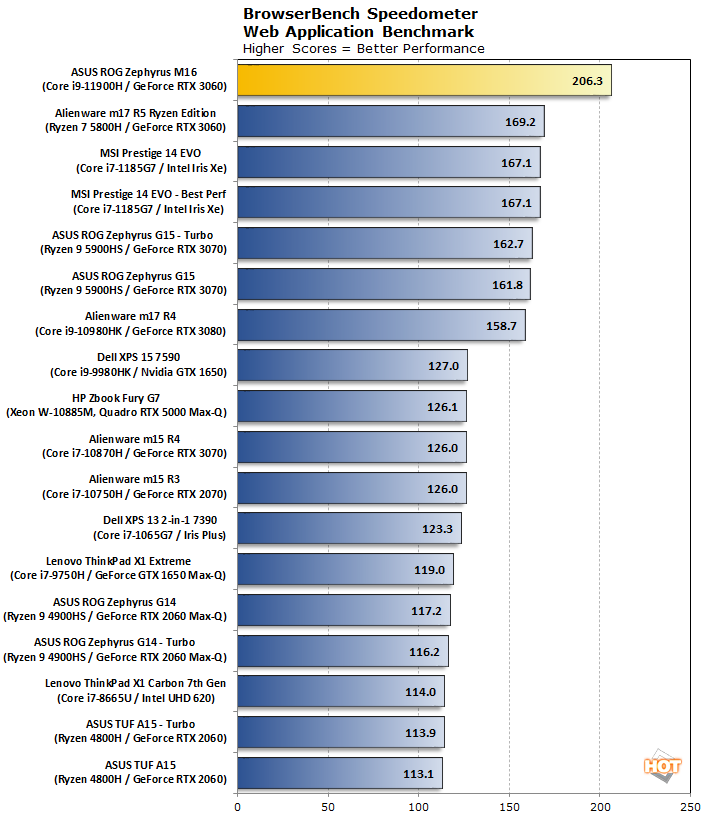
We use BrowserBench.org's
Speedometer test to gauge our web experiences, which takes a holistic look at web application performance. This test automatically loads and runs several sample web apps from ToDoMVC.com using the most popular web development frameworks around, including React, Angular, Ember.js, and even vanilla JavaScript. This test is a better example of how systems cope with real web applications, as opposed to a pure JavaScript compute test like JetStream. All tests were performed using the latest version of Chrome.
The Core i9-11900H in the ASUS ROG Zephyrus M16 makes this notebook the fastest one we've ever tested in a shipping retail notebook in Speedometer, by far. It didn't just beat the handful of recent notebooks by a full 20%, it almost doubled up on the older Zen 2 notebooks and the 10th Gen Core CPU in the
Alienware m15 R4 that we reviewed just a couple short months ago. Intel's new gen of performance notebook processors is extremely impressive, and the M16 benefits from the newer hardware (and Windows updates) in a big way.
|
|
Cinebench R20 and R23 |
| 3D Rendering Performance |
|
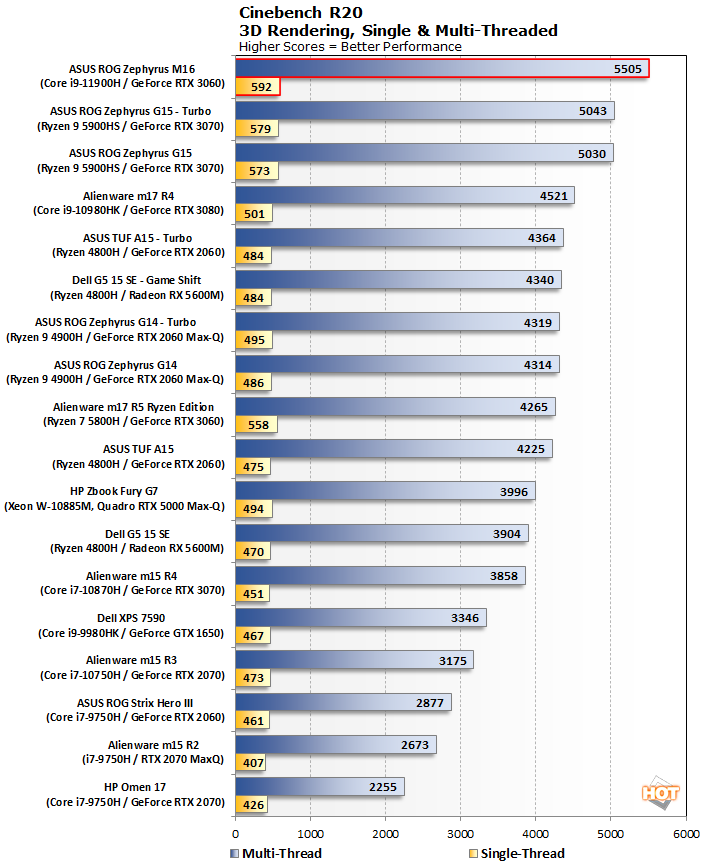
The previous version of Maxon's rendering benchmark,
Cinebench R20, takes longer to complete, so this is a better test of a notebook's cooling system. This release also drops the OpenGL test, making Cinebench a pure CPU benchmark this time. We tested both single-threaded and multi-threaded performance here.
The Core i9-11900H lets the Zephyrus M16 once again come out on top. The margin of victory wasn't as immense but it's still 10% faster than the
ROG Zephyrus G15 with AMD's fastest mobile CPU and beats all other challengers by a more substantial margin. We knew Tiger Lake-H would be a beast, but seeing it in a retail sample is pretty wonderful.
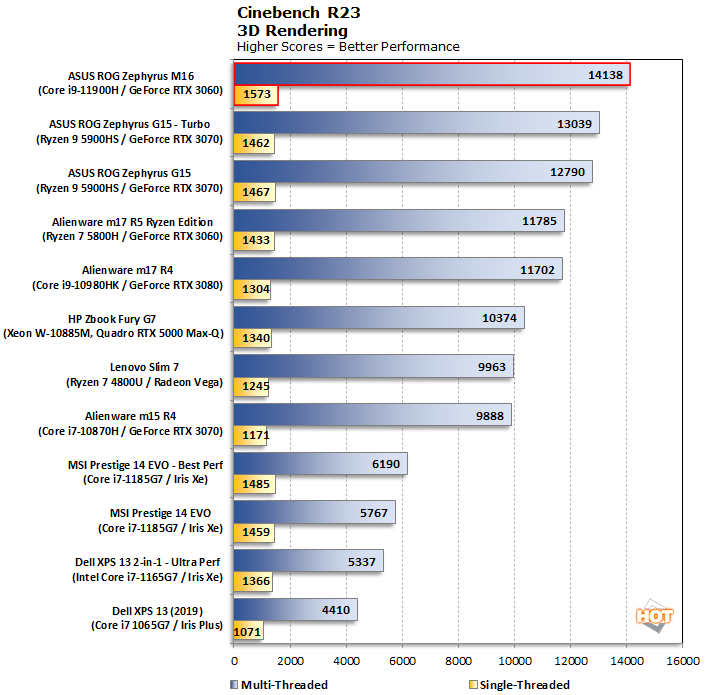
The newest benchmark from Maxon, Cinebench R23, renders the same scene as R20 but with the company's latest rendering engine with support for all current gen hardware.
Just like before, the ROG Zephyrus M16 comes out on top by around 10 percentage points ahead of the next-fastest competitor. Rendering isn't the sort of thing most notebook buyers are doing on their portable gaming PCs, but it's a good indicator of both single- and multi-threaded prowess. The ASUS M16 delivers the goods here.
|
| Geekbench 5 |
|
Single and Multi-Core Performance |
|
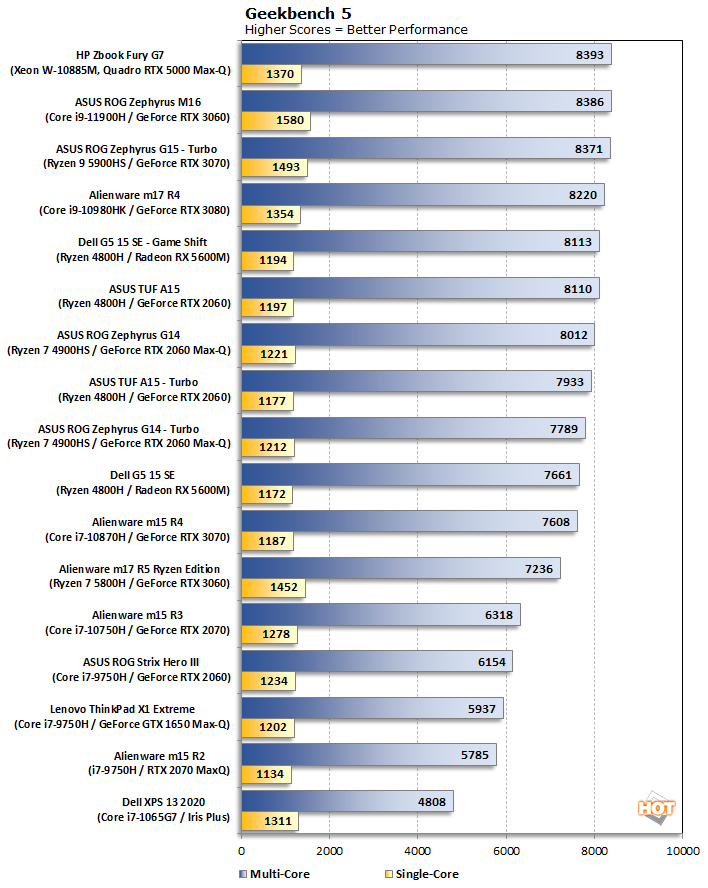
Geekbench is a cross-platform benchmark that simulates real world processing workloads in image processing and particle physics scenarios. We tested the notebooks featured here in Geekbench's single and multi-core workloads. We've retired Geekbench 4 because version 5 performs many of the same tests, which have been updated with the latest CPU architectures and features in mind.
The ROG Zephyrus M16 essentially ties the Zen 3 notebooks we've reviewed in the multi-threaded tests, but turns in the very best single-threaded result we've encountered to date. We already knew Tiger Lake had some serious IPC under the hood, and that has been unleashed with the bigger thermal budget and appropriately high turbo clocks.
|
| PCMark 10 |
|
Productivity and System-level Benchmarking |
|
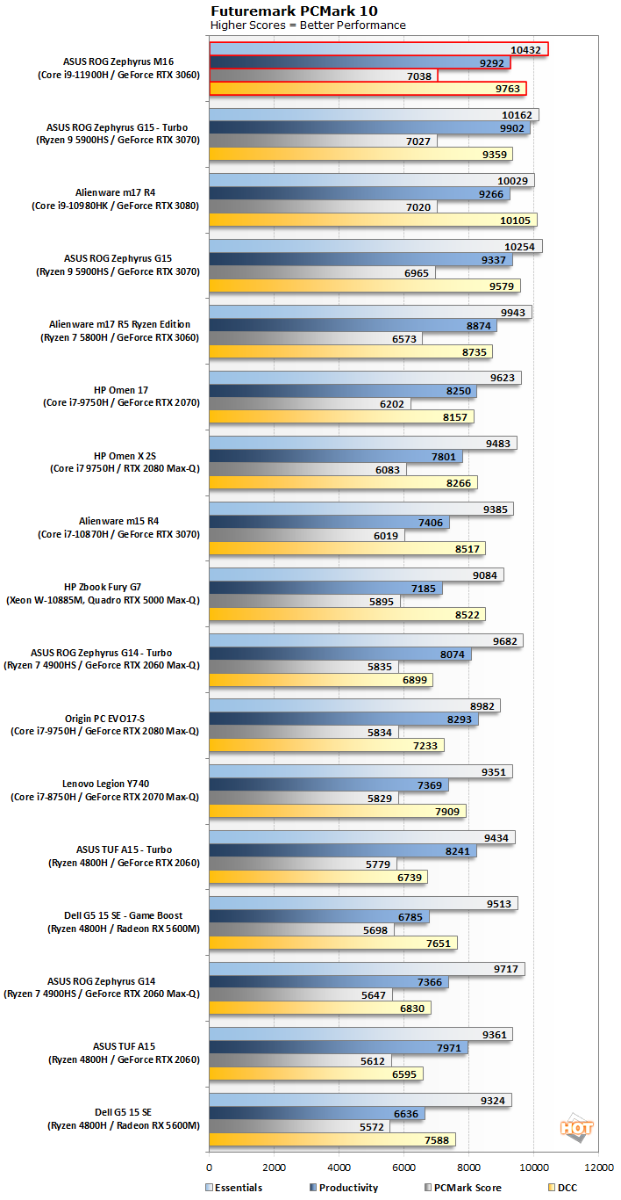
PCMark 10 uses a mix of real-world applications and simulated workloads to establish how well a given system performs productivity tasks, including image and video editing, web browsing, and OpenOffice document editing. While these scores appear to be all over the place, the systems are sorted by their overall PCMark score, which is the third (gray) bar in each cluster.
Here we see just the slimmest margin of victory over the AMD-equipped competition. The Intel 10th-gen fueled Alienware m17 R4 is also very close behind, essentially making for a three-way tie with the ROG Zephyrus G15 and the
Alienware m17 R4.
Now it's finally time to get down with some 3D graphics and gaming tests.
|
| 3DMark Benchmarks |
| 3D Performance |
|
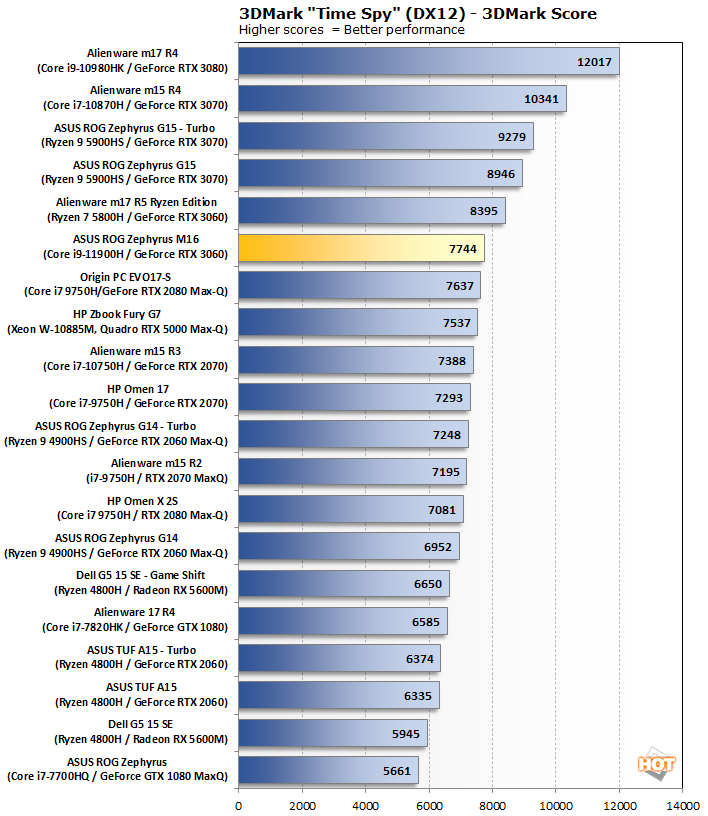
3DMark has several different graphics tests which focus on different types of systems. We start with Time Spy, which is 3DMark's headline benchmark. This test presents a pretty significant challenge for the system's CPU and GPU using DirectX 12's API...
Here's where the GeForce RTX 3060 starts to factor in, and its 80 W TDP kind of lets the whole system down. This notebook and its lower-power version of its GPU is around 8% slower than the 125 W 3060 found in the
Alienware m15 R5 Ryzen Edition notebook. It's a different balance of performance, power consumption, and weight that leans in the Alienware's favor on the performance side. The M16 is a fair bit smaller overall than that notebook, and the lesser thermal budget shows.
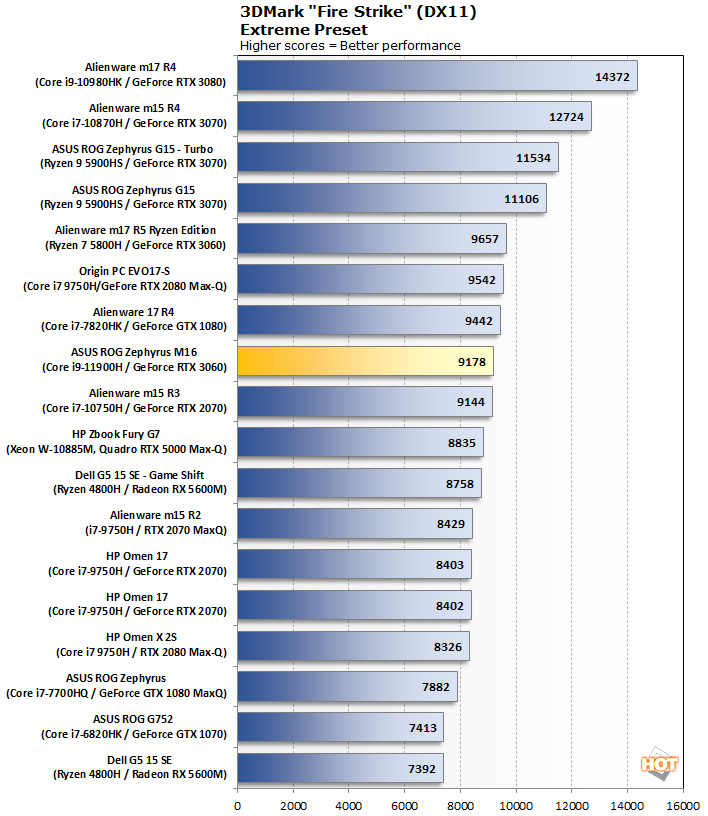
Next up, let's take a look at the Extreme preset for the punishing 3DMark Fire Strike test. This DirectX 11 test has been around for a while, but it's still pretty challenging.
We saw the same thing in the Fire Strike Extreme test. Here, the ROG Zephyrus M16 is a bit closer to the Alienware system, but it still trails by a few percentage points. Still, up over 9,000 is a pretty decent showing for this system, and it's actually a good amount faster than most of the last-generation GeForce RTX 2070 notebooks.
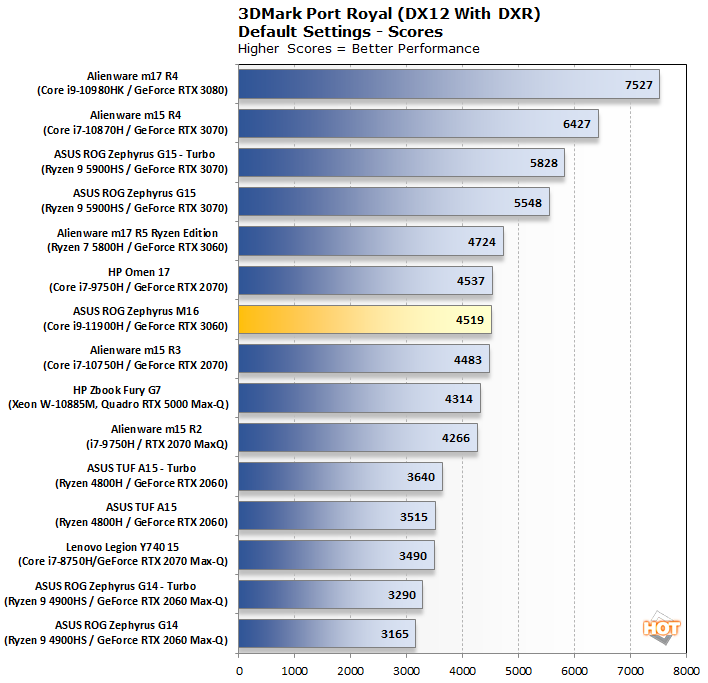
Lastly, the Port Royal test uses DirectX
Ray Tracing (DXR) to illuminate a scene...
This test only works with GPUs that have DirectX Ray Tracing hardware, so there are fewer results. However, the overall trend is the same: the ROG Zephyrus M16 trails the Alienware m15 R5 Ryzen Edition by a slim margin thanks to its lower power budget for the GPU. It's not a bad showing at all, and it's again faster than most RTX 2070 notebooks from prior years.
|
| Far Cry 5 |
| Gaming Performance |
|
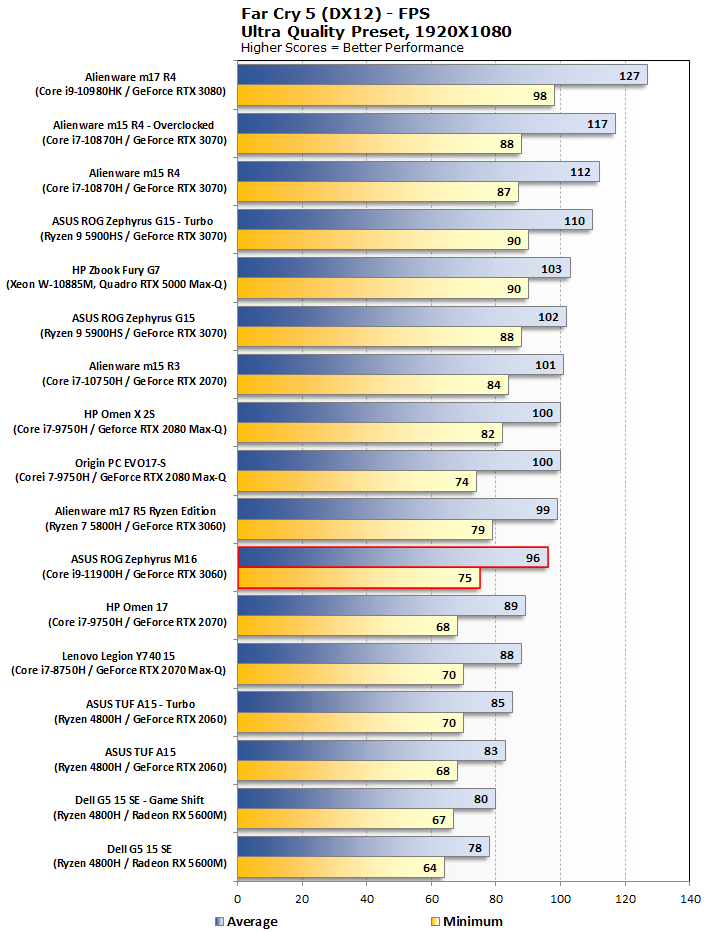
Far Cry 5 takes the franchise to Montana with lush environments and incredible graphics fidelity. We ran this laptop through the built-in benchmarks with Ultra Quality settings.
Moving away from synthetic 3D testing into actual games, the GeForce RTX 3060 and its 80 Watt TGP tumbles down the standings a small amount along with the Ryzen-powered Alienware. They're actually quite close this time, however. This could be due to the way ASUS gives extra power to the GPU if the processor doesn't need it, and as we've discovered recently, Far Cry games
tend to be lightly-threaded.
|
| Gears 5 |
| Gaming Performance |
|
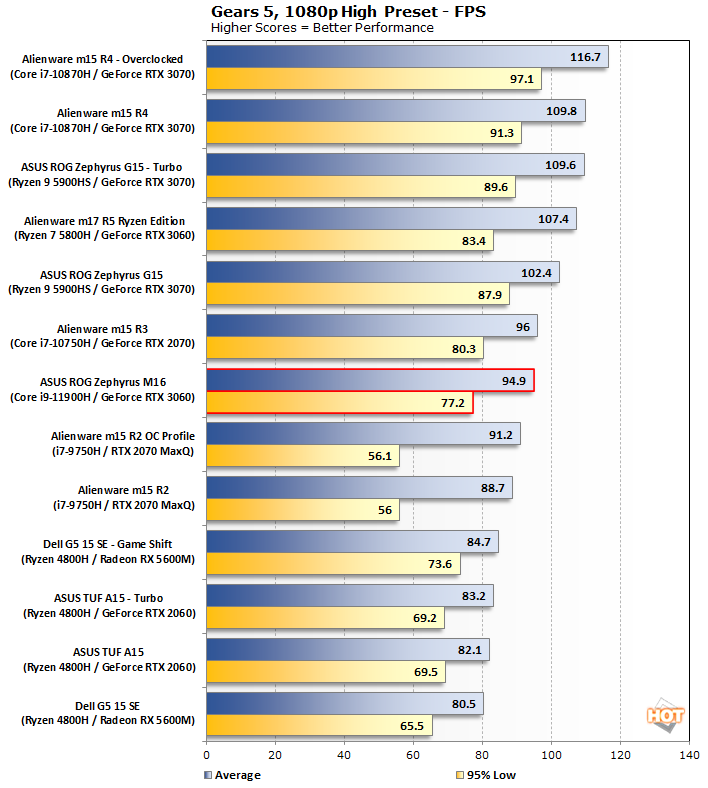
Gears 5 is a tremendously popular title on the Xbox and PC alike, and on top of looking great, it's a blast to play. Due to the relative newness of the game, we don't have a ton of notebooks represented, so we intermingled some desktop GPU results for reference. We used the High preset at 1920x1080, same as before, to test this game.
In
Gears 5, we see a much bigger gap between the ROG Zephyrus M16 and the Alienware m15 R5. Performance at 1080p is still very good and smooth, as the frame rate stays high even in the dips.
|
| Middle Earth: Shadow of War |
| Gaming Performance |
|
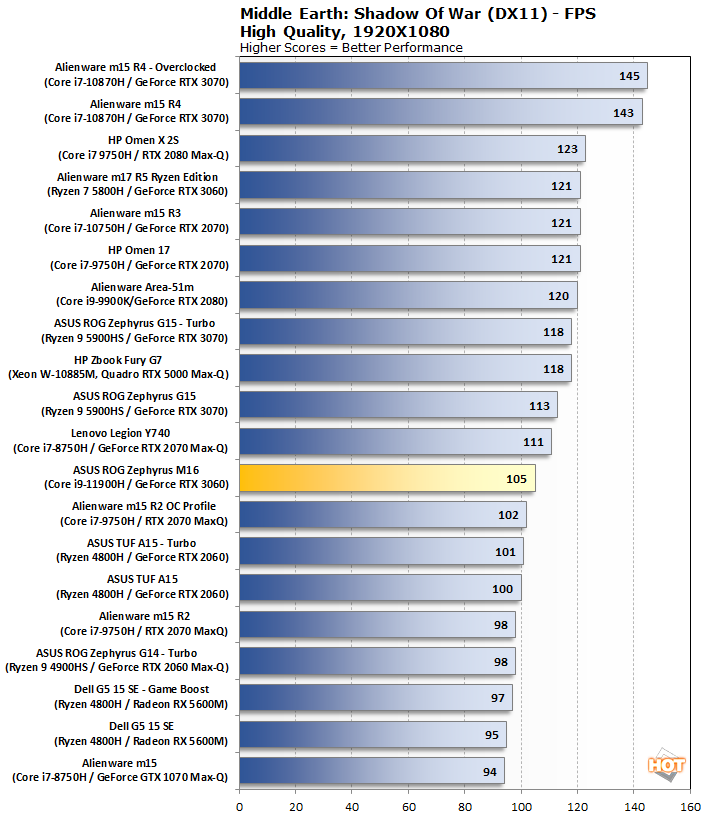
Middle Earth: Shadow of War is a fun and and beautiful title set in Tolkien's Lord of the Rings universe. To test the game's performance relative to other systems, we set the resolution to 1920x1080 and turned the visuals up to the High preset. The frame rates here are the average reported by the built-in benchmark.
Shadow of War also exposes a pretty significant gap between notebooks with the same GPU. Maintaining over 100 fps is again very solid, however. We're more concerned about games coming down the pipe that may be more taxing. While more often than not, the ASUS system could outpace the GeForce RTX 2070 notebooks on our chart, this time it even falls behind those.
|
| Shadow of the Tomb Raider |
| Gaming Performance |
|
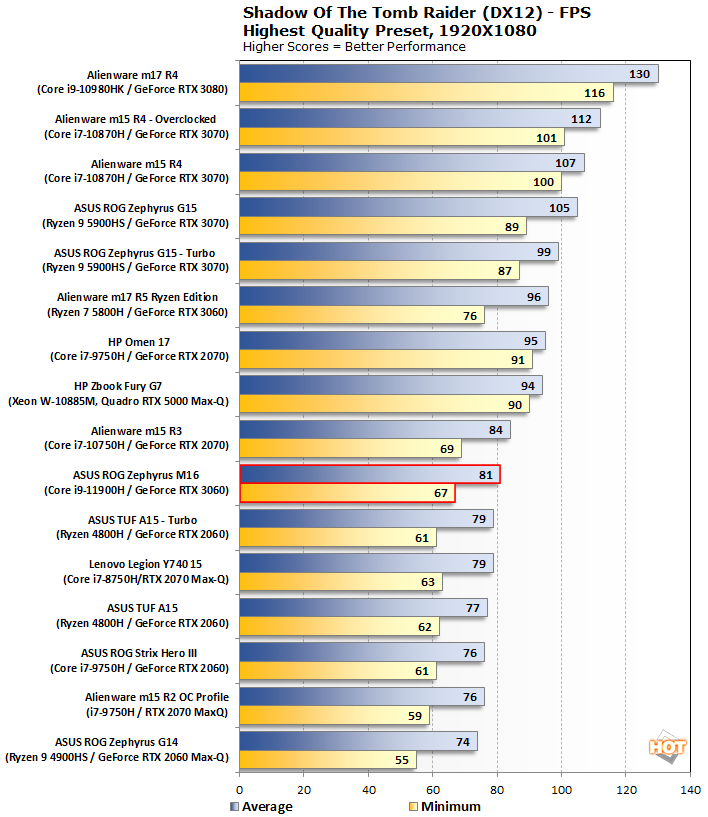
The finale in the rebooted
Tomb Raider trilogy, Shadow of the Tomb Raider is easily the best-looking of the bunch. It's also brimming with Tobii eye-tracking hardware support, and leading edge graphics technologies. To test this game out, we again turned the visuals up to High and tested at the Full-HD resolution of 1920x1080.
Our last gaming test shows another sizable gap with the RTX 3060-powered Alienware system. This is just the price of portability vs. performance. ASUS has chosen to go with a lighter weight and smaller footprint, and had to reduce the thermal and power budget accordingly.
|
| Battery Performance |
|
Gaming and Video Playback Performance |
|
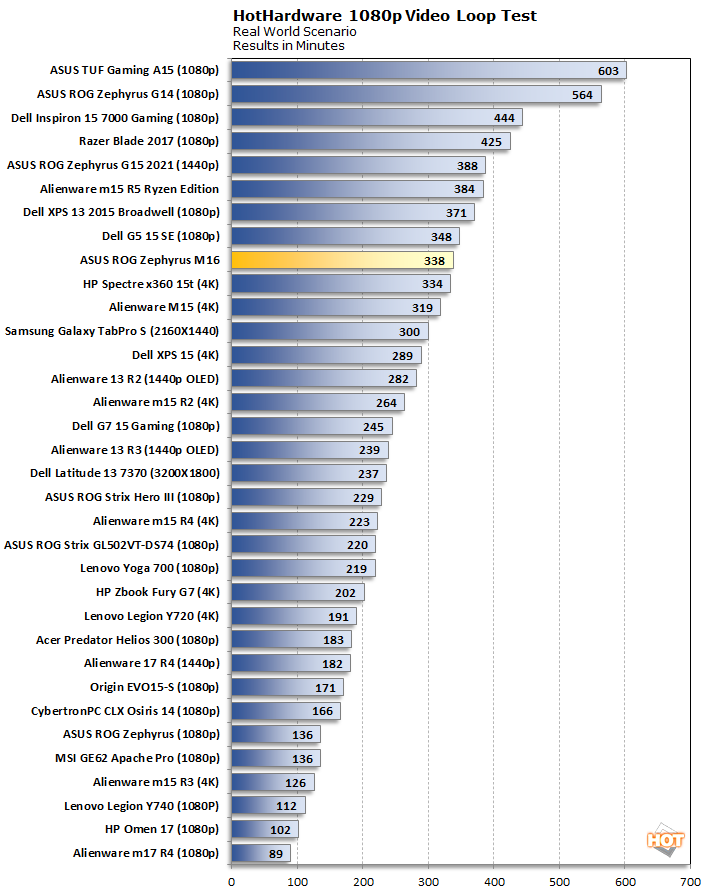
We run a custom 1080p HD video loop test developed in-house, to prove out battery life with our test group of machines. In all tests, Windows 10 Quiet Hours has been enabled and the displays are calibrated with lux meters on pure white screens to as close to 115 lux as possible. For the average laptop this is somewhere between a 40-60 percent brightness setting. In the case of the Alienware m17 R4, this required lowering the brightness to 33 percent on the slider in the Windows 10 sidebar.
Battery life here is pretty solid. Five and a half hours of just watching videos on a plane is more than enough to handle the vast majority of travel. The Zephyrus M16 has a 90 Wh battery to keep it going, and while some ultra-portable notebooks and a couple of other gaming laptops are more long-lasting, the ASUS ROG Zephyrus M16 does a nice job of keeping the party going.
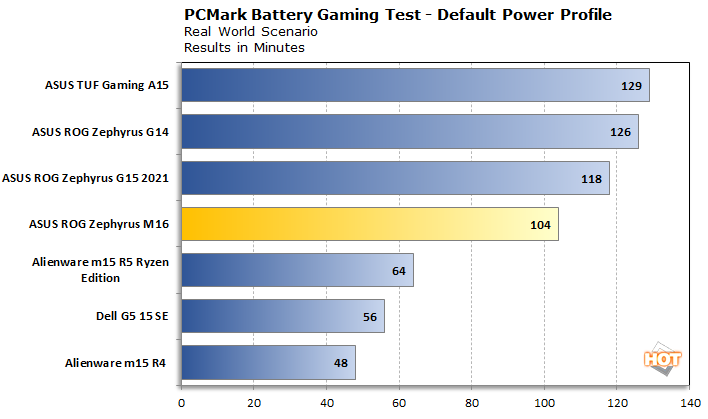
PCMark's Gaming test loops the Fire Strike demo repeatedly until the PC gives up and shuts down. While there's a hit in the performance department while running on battery, we felt like the demo ran pretty smoothly all things considered, with frame rates sticking in the 30s according to the in-scene counter. That's not as fast as it is on AC power, but it's enough to power through some lighter titles. How long does the juice pack last, though?
Once again, the ASUS ROG Zephyrus M16 doesn't have the longest endurance, but it still lasted a full hour and 44 more minutes running this torture-test of a battery benchmark. More often than not, the battery is meant to be more of an uninterruptable power supply in a gaming notebook, but it seems that ASUS did a nice job balancing endurance and performance.
Let's head on to the teardown, where we can see how the M16 keeps everything cooled.