Alienware m18 R1 Laptop Review: Brawny Beauty, Untapped Potential
Alienware m18 R1 Review: Software, System Benchmarks And Game Performance
Alienware Command Center
We received this machine from Dell quite some time ago. Some of the delay in releasing this review was due to Alienware Command Center. Some updates were required to iron out a few issues we initially experienced.

Alienware also sent us an AW620M mouse for testing.
The key factor is that, without Alienware Command Center, the system will not honor any performance profile you set in the system setup utility. In other words, you can boot into the UEFI setup and select a default performance profile, but as soon as you boot into Windows it will be reset to the "Quiet" profile. To actually get another profile to activate, you must use AWCC and select it there in Windows.
However, sometimes, a game will have a pre-defined profile in the software, and that will also override whatever performance profile you select. For example, if you want to play a game in Quiet or Battery or even "Overdrive" mode, you may have to open the game's profile in AWCC and change that setting, as it seems like most (or possibly all) games default to the "Performance" profile.

Currently, it seems that Alienware Command Center has an information-sparse form over function design with some questionable UX choices. As an example, it has a default-on overlay that can keep track of your hardware status. This might be useful if someone doesn't want to install something like RTSS or even simply use the GeForce Experience overlay, except you can't have the overlay show you your CPU and GPU temperature at the same time as usage; temperature can only be shown along with relative fan speed.

In any event, the important thing to know about Alienware Command Center is that you have to use it to adjust the AlienFX RGB LED lighting and the performance profiles on your system. These profiles can have a very large impact on both battery life as well as how games perform, so make sure you stay advised of what profile you're using at any given time.

Prior to running any benchmarks on a system, we apply all of the latest Windows and driver updates available for it. Our particular Alienware m18 R1 sample shipped with Windows 11 Pro 22H2 and while the operating system needed minimal updating, it came with an outdated version of Alienware Command Center, an out-of-date GeForce driver, and pre-release firmware. After applying those updates, we ran all of our tests with out-of-the-box settings. Our goal is to test the system as close to the way it ships as possible.
There is one additional consideration, though. This machine gives users the option to configure the discrete GPU to operate in a hybrid mode (NVIDIA Optimus) that switches between the Core i9-13980HX's iGPU and the GeForce RTX 4090 dGPU depending on the workload, or in an always-on mode that keeps the GeForce powered up and directly connected to the display to provide the best performance. Aside from our battery life tests, all of our benchmarks were run with the always-on discrete graphics mode enabled.
There is one additional consideration, though. This machine gives users the option to configure the discrete GPU to operate in a hybrid mode (NVIDIA Optimus) that switches between the Core i9-13980HX's iGPU and the GeForce RTX 4090 dGPU depending on the workload, or in an always-on mode that keeps the GeForce powered up and directly connected to the display to provide the best performance. Aside from our battery life tests, all of our benchmarks were run with the always-on discrete graphics mode enabled.
With that in mind, we performed all of our benchmarking with the system set to "Performance" mode, as that's the default that it shipped with out of the box. We did battery tests in "Performance" mode with NVIDIA Optimus enabled, but we also did them in "Battery" mode to see what the machine is capable of. We'll get to those on the next page; first, let's look at how this thing performs.
ATTO Disk Benchmark
The ATTO disk benchmark is a fairly quick and simple test which measures read/write bandwidth and IOPS across a range of different data sizes. While we don't typically compare these results across multiple machines, it's useful to gauge whether a particular notebook's storage subsystem is up to snuff.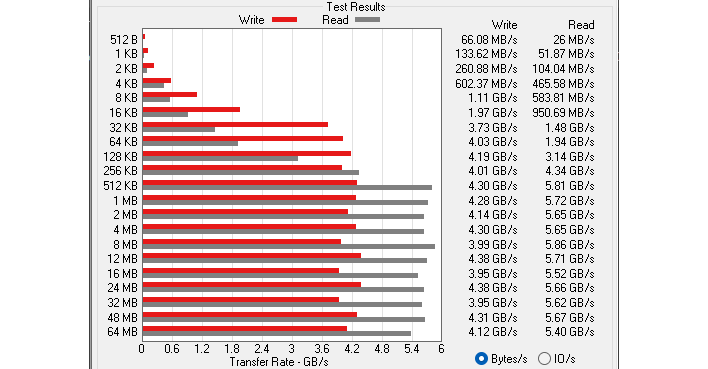
The Micron SSD that shipped with our Alienware m18 R1 is a very close relative of the Crucial P5 Plus, and while that drive launched as a high-end model two years ago, it's now settled into a solidly-midrange positioning with completely reasonable performance. We don't have any complaints about the performance of this SSD, and there's a second M.2-2280 slot very easily-accessible under the bottom cover if you need or want more storage.
We do have to opine about the presence of two M.2-2230 slots, though. These slots are significantly less useful than longer 80mm slots, and while we understand that this is a portable machine and space is somewhat at a premium, there's plenty of space inside the chassis for longer slots. Considering the system supports NVMe RAID, we would have liked to have seen the ability to stuff those additional slots with more common M.2-2280 drives.
Speedometer 2.0 Browser Benchmark
We use BrowserBench.org's Speedometer test to gauge our web experiences, which takes a holistic look at web application performance. This test automatically loads and runs several sample web apps from ToDoMVC.com using the most popular web development frameworks around, including React, Angular, Ember.js, and even vanilla JavaScript. This test is a better example of how systems cope with real web applications as opposed to a pure JavaScript compute test like JetStream. All tests were performed using the latest version of Chrome.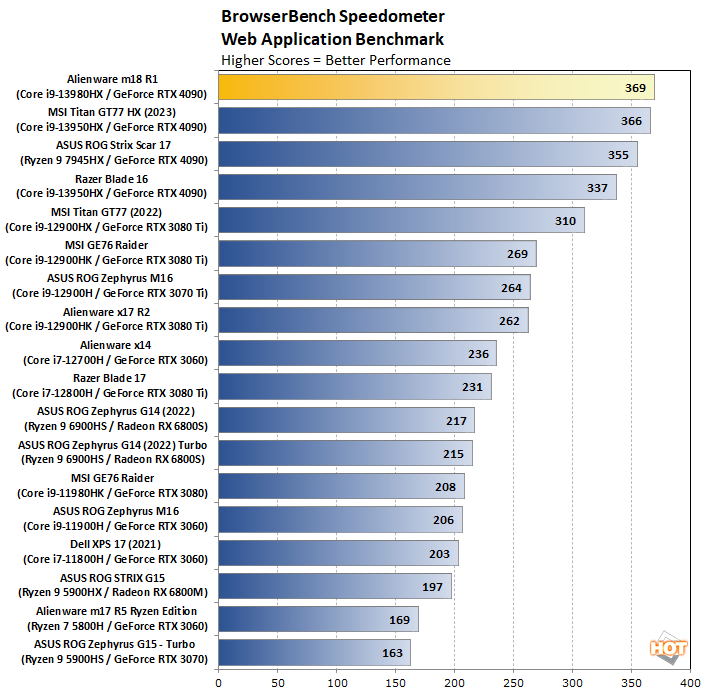
The m18 R1's Intel Core i9-13980HX CPU is nearly identical to the Core i9-13950HX found in some of its competitors. The biggest change as far as performance is concerned is the addition of Thermal Velocity Boost. As long as the CPU is within its thermal limits, it gets an extra 100 MHz of boost clock to play with. That could be what pushes the m18 R1 to the top of the list in this heavily single-threaded benchmark.
Of course, this benchmark is also sensitive to browser updates, and we unfortunately don't have all of these systems on hand to re-test with the latest browser version. As such, it's not unusual that the newest system benchmarked is the fastest in this test. Either way, though, this machine screams in web apps—exactly as expected.
Cinebench R23 Rendering Benchmark
This is the latest 3D rendering benchmark from Maxon, based on the Cinema 4D R23 rendering engine. It's a purely CPU-based test that doesn't make use of the graphics processor at all, and it scales very well with additional CPU cores. We ran both single- and multi-threaded tests on all of the notebooks represented here.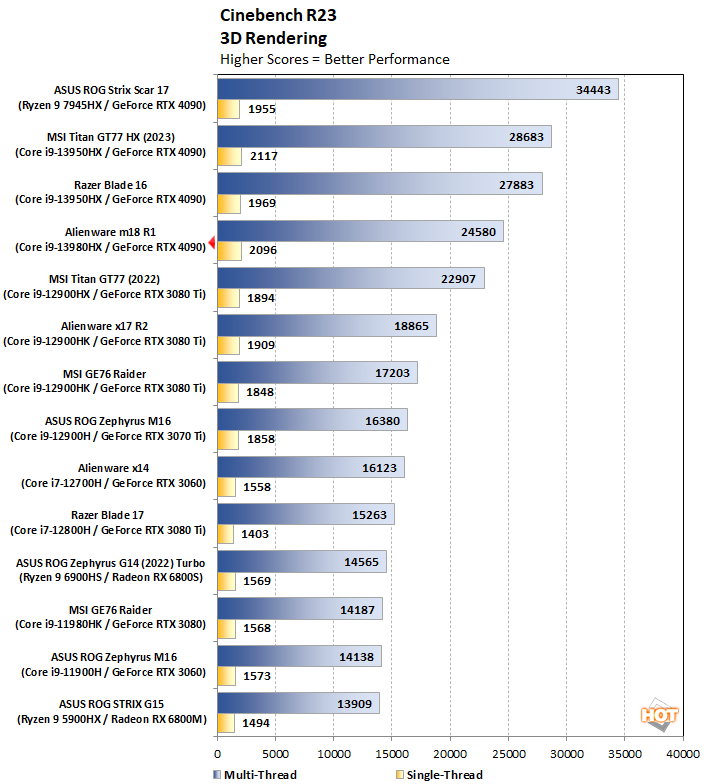
Here we start to see the first inkling that something is amiss in the Alienware m18 R1. While the single-threaded test is more or less in the right ballpark, the multi-threaded result is not as good as it should be, falling behind the other two 13th-gen Core systems (to say nothing of the AMD-based ASUS ROG machine.)
As we'll detail on the next page, this is largely down to the CPU slamming up against thermal limits. The m18 R1's impressive cooling wasn't able to tame the insanely-hot Intel Raptor Lake chip.
Geekbench 5 System Benchmark
Geekbench is a cross-platform benchmark that simulates real world processing workloads in image processing and particle physics scenarios. We tested the notebooks featured here in Geekbench's single and multi-core workloads. It measures single-threaded performance allowing a single core to stretch its legs, and multi-threaded throughput to put all cores under a heavy load.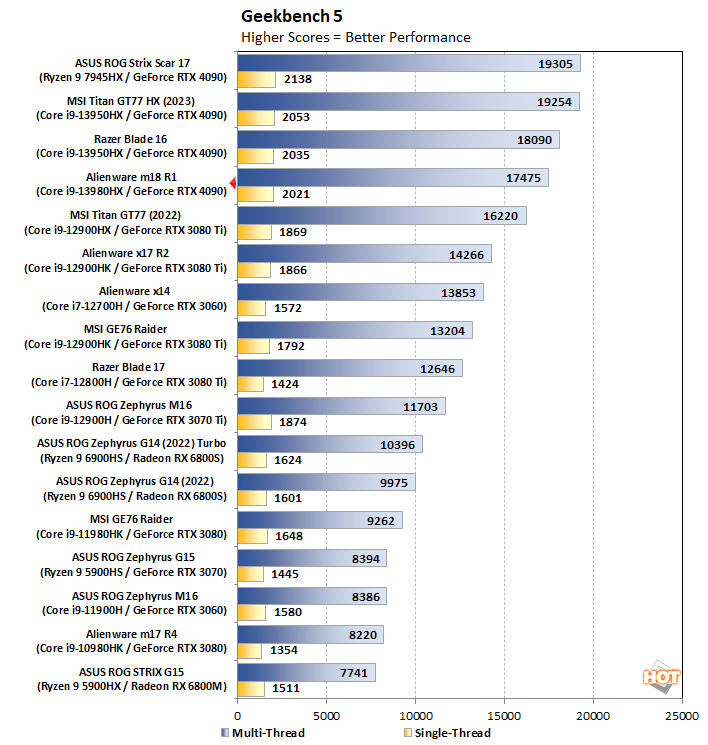
While it also has single- and multi-threaded tests, Geekbench consists of a barrage of benchmarks instead of a single task for the CPU to churn away at, and so it doesn't suffer as much from the system's thermal issues. The Alienware m18 R1 still ends up behind the fastest systems we've tested in this benchmark, though.
PCMark 10 System Benchmarks
PCMark 10 uses a mix of real-world applications and simulated workloads to establish how well a given system performs productivity tasks, including image and video editing, web browsing, and OpenOffice document editing. While these scores appear to be all over the place, the systems are sorted by their overall PCMark score, which is the fourth (yellow) bar in each cluster.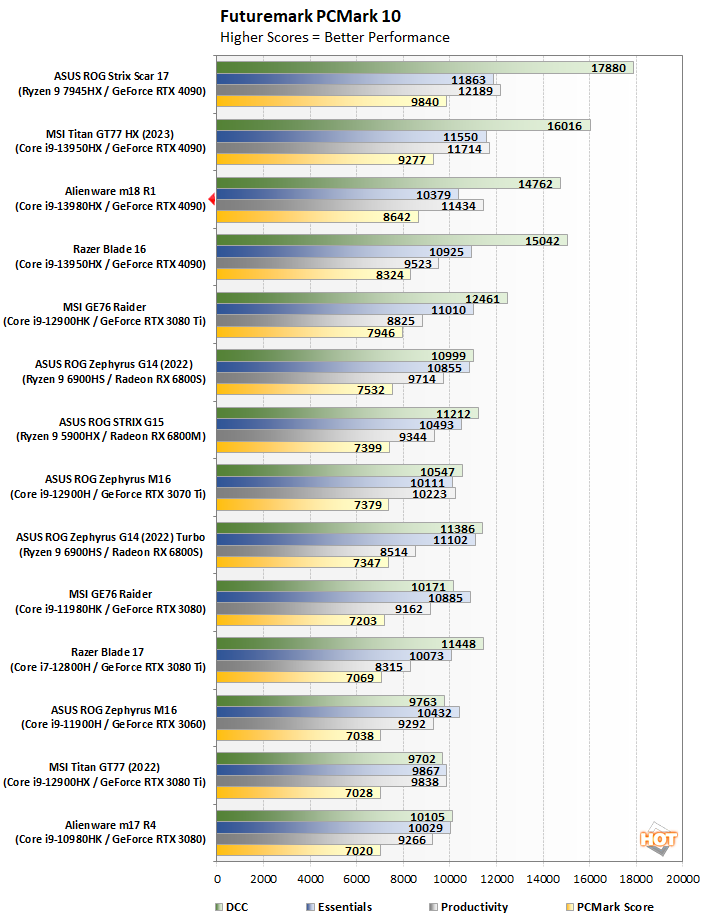
A sub-par Productivity score for the Razer Blade 16 allows the Alienware m18 R1 to creep ahead despite lower scores on the Essentials and Digital Content Creation tests. We tested that machine way back in February, and PCMark 10 had some early teething issues with the GeForce RTX 4000 series GPUs, so it's possible that that score was affected by those problems.
In any case, the result for the m18 R1 here is pretty darn decent—even if unexceptional next to its 13th-gen peers.
3DMark Graphics And GPU Tests
The venerable 3DMark has numerous different graphics tests that focus on various sorts of systems. We start with Time Spy, which was 3DMark's headline benchmark until just recently. This test presents a pretty significant challenge for the system's CPU and GPU using Microsoft's DirectX 12 API.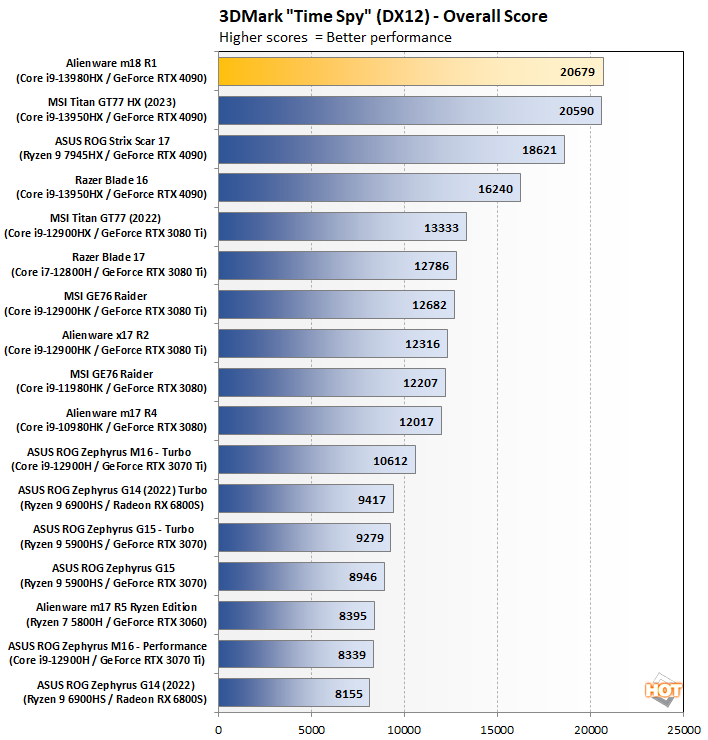
The m18 R1 just barely sneaks ahead of the MSI Titan GT77 HX here, to take the top spot in our Time Spy ranking. The result here is nothing short of spectacular, and it's not a fluke, either—this is the average result of three runs. The system's fans surely scream by the end of a Time Spy test, but the results speak for themselves.
3DMark's Fire Strike is an older test that is intended to represent performance in DirectX 11 games. We use the "Extreme" preset, which increases the detail and bumps the resolution up to 2560×1440. Fire Strike may not be on the bleeding edge of GPU benchmarks anymore, but it can still put the hurt on a system.
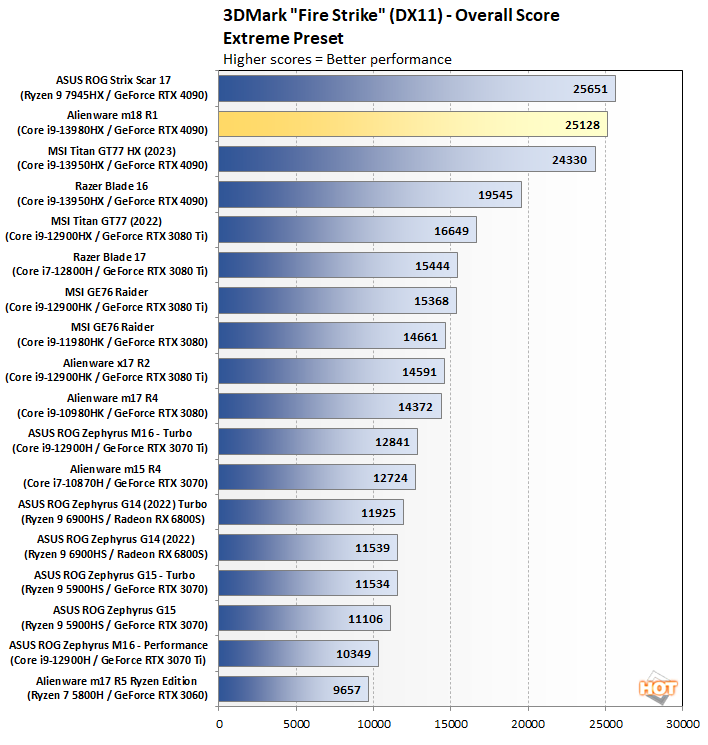
Just like the DirectX 11 games that it simulates, Fire Strike can be pretty sensitive to CPU single-threaded performance, and so the Zen 4-based Ryzen system edges its way to the top, but only just barely. The Alienware machine is the fastest of our Intel-based GeForce RTX 4090 laptops in this benchmark, which means that if you equip it with the 480-Hz display, it'll be the perfect Counter-Strike 2 machine.
The second-newest of 3DMark's tests for high-end systems is Port Royal. This benchmark was introduced with NVIDIA's Turing GPUs to test the ray-tracing capabilities of graphics processors. It's no secret that NVIDIA dominates in this benchmark, but we do idly wonder if UL expected ray-tracing performance to scale as quickly as it has over the last three GPU generations.
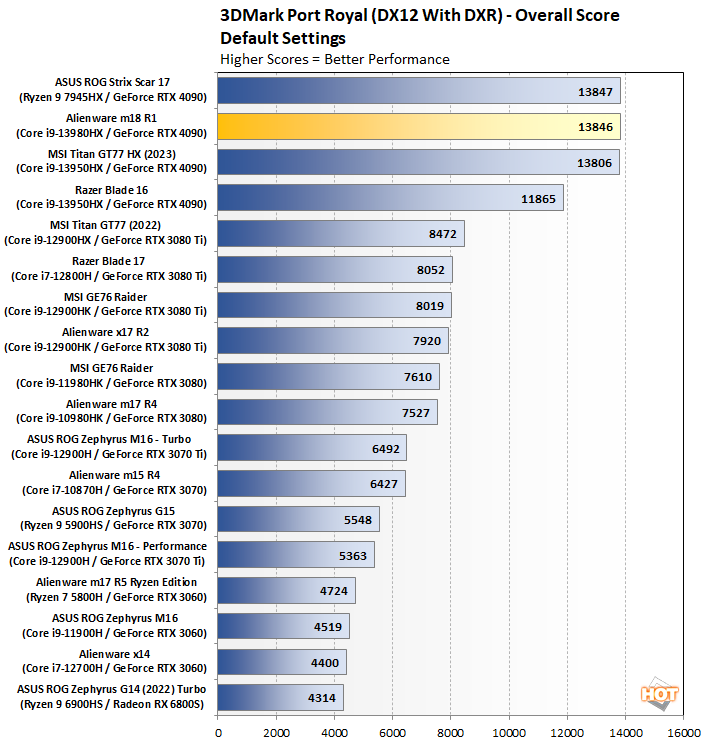
Port Royal is an extremely GPU-heavy test that barely hits the CPU at all. It is one of the purest GPU tests in the 3DMark suite, and it's no surprise that our three RTX 4090 laptops come in with margin-of-error results. The m18 R1's GPU cooling is beyond reproach, so its mobile GeForce RTX 4090 is free to stretch its legs all the way up to a recorded 2,370 MHz.
Middle Earth: Shadow Of War Tests
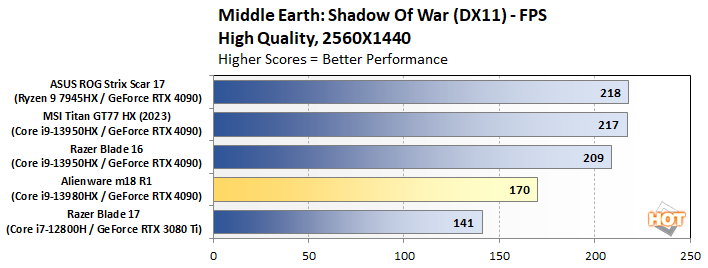
Middle Earth: Shadow of War is a fun and and beautiful title set in J. R. R. Tolkien's Lord of the Rings universe. To test the game's performance relative to other systems, we set the resolution to 1920x1080 and turned the visuals up to the High preset. The frame rates here are the average reported by the built-in benchmark; we don't report the minimum FPS because those numbers are extremely variable.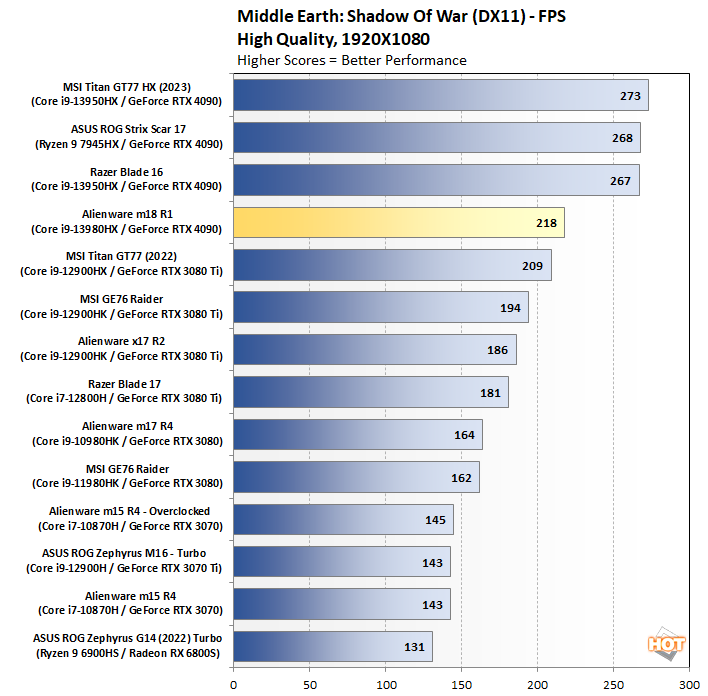
Synthetic benchmarks aside, the Alienware m18 R1's CPU cooling problems rear their head in real games. Shadow of War is very sensitive to CPU performance, as the open-world DirectX 11 title draws massive numbers of animated entities on the highest settings. This performance certainly isn't bad, but it's clearly behind the other Geforce RTX 4090 laptops.
Shadow Of The Tomb Raider Benchmarks
The finale in the rebooted Tomb Raider trilogy, Shadow of the Tomb Raider is easily the best-looking of the bunch. It's also brimming with Tobii eye-tracking hardware support and leading-edge graphics technologies. To test this game out, we again turned the visuals up to their highest preset and tested at the FullHD resolution of 1920×1080, and then again at 2560×1440.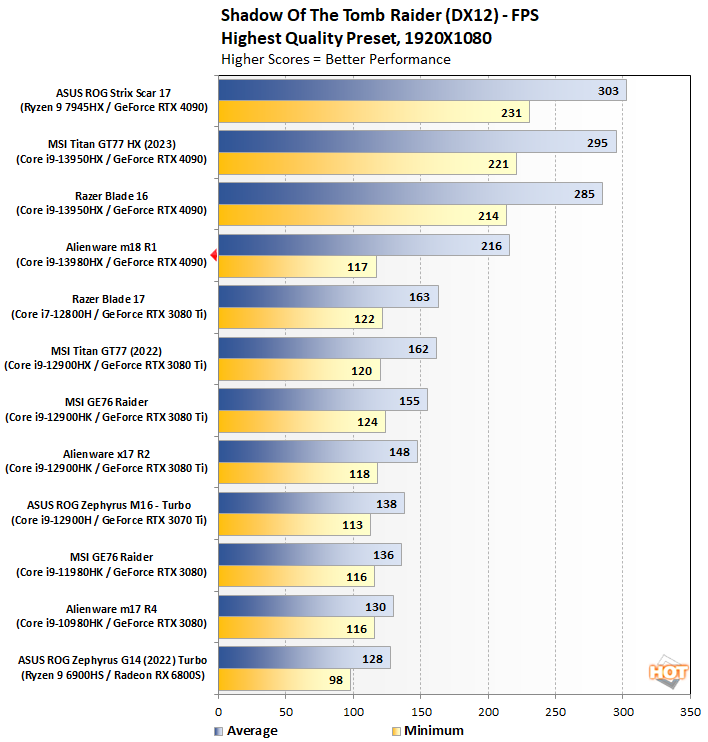
This result is particularly bad, but once again, recall that this is the average of three benchmarks. Actually, I ran the full suite of benchmarks on this system no less than five times, with each "run" being a full set of three tests for each benchmark. That's neither here nor there, but the point is that this isn't a fluke result; it's consistent. Shadow of the Tomb Raider is heavy on the CPU as well, and this system couldn't keep up with some of the other high-end RTX 4090-equipped laptops we've tested recently.
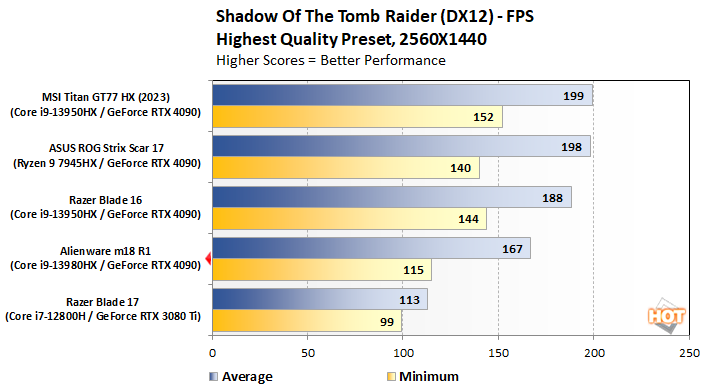
Once again, cranking up the resolution to 2560×1440 does improve things, but the m18 R1 still trails its hardware cousins in this game. The results would likely be even closer at 4K, but unfortunately, that's not an option with this laptop (unless you hooked up an external 4K display.)
F1 2021 Benchmarks
F1 2021 supports DirectX 12 with ray tracing, and it incorporates support for a number of technologies like AMD's FidelityFX Super Resolution (FSR) and NVIDIA's DLSS. We tested the game in its Ultra High graphics preset, with ray-tracing and TAA enabled at a couple of resolutions.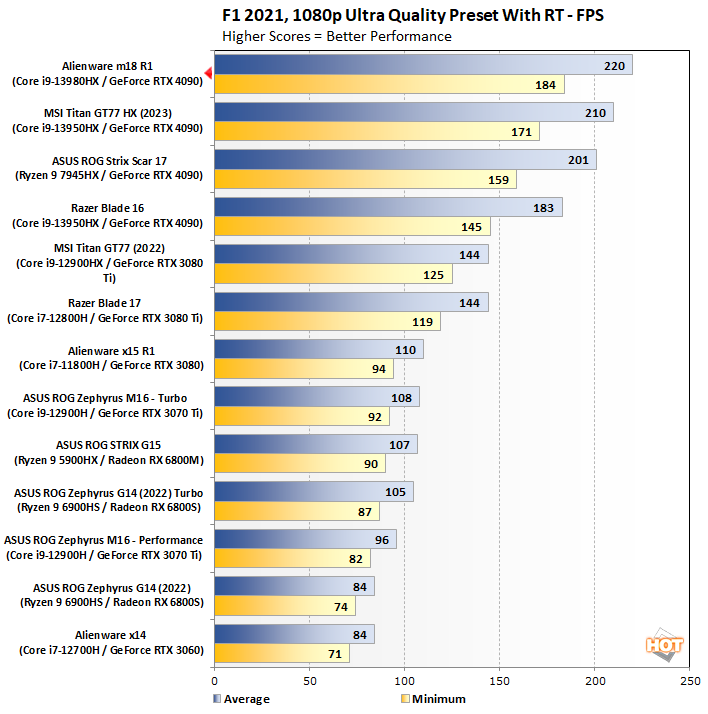
F1 2021 is largely a solved problem for modern systems. It's light on the CPU despite being a DirectX 12 title, partially due to its implementation of ray-traced effects. It runs fantastically on the Alienware m18 R1, and is a showcase of what this system can do when the CPU and GPU aren't simultaneously taking the cooling hardware.
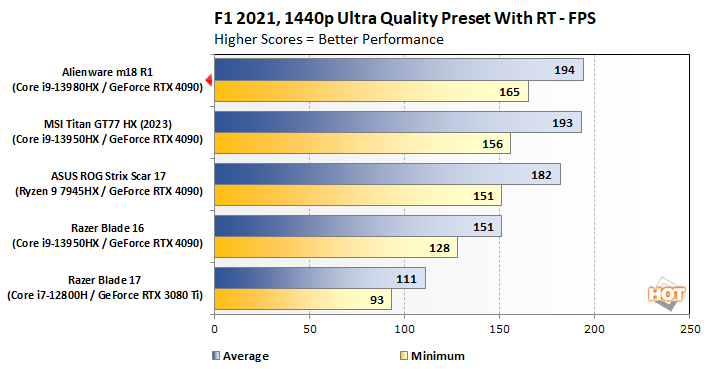
Cranking up the resolution to 2560×1440 allows the other RTX 4090 machines to creep closer to the m18 R1 in terms of average FPS, but it retains an advantage in minimum frames. A 165-FPS minimum frame rate is kind of awesome, but someone with this machine should probably be playing the much-more-demanding F1 22, anyway.
Marvel's Guardians Of The Galaxy
Marvel’s Guardians of the Galaxy is an action-adventure game where you play as Star-Lord and lead the rest of the Guardians on a variety of action-packed and sometimes-wacky missions. The game’s minimum requirements call for a Radeon RX 570 or GeForce GTX 1060-class GPU, but it also supports some of the latest graphics technologies, including DXR and DLSS.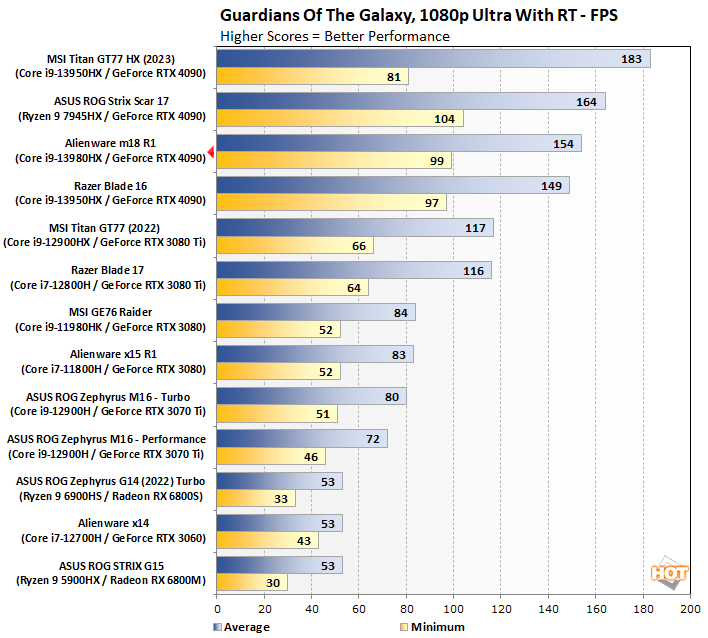
This result is an interesting one, and not exactly what we would have expected. It's not a bad showing for the m18 R1, but it's curious that it falls behind the MSI Titan in averages while significantly leading it in minimums. Guardians of the Galaxy has significant loading stutters the first time you run the benchmark, so we typically discard the first run for that reason. Variability between runs and and driver changes could account for some of the differences here.
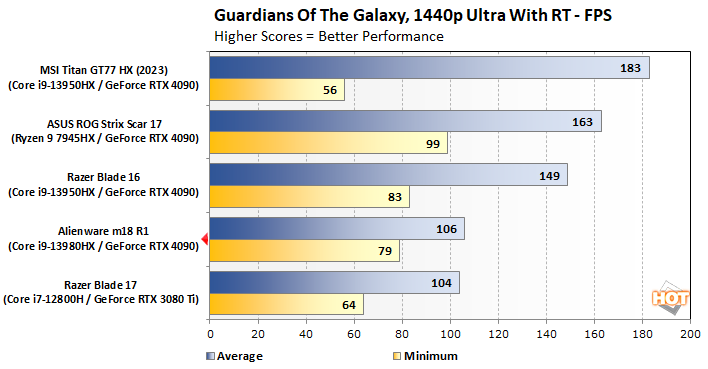
Even with ray tracing enabled, the extremely-detailed Guardians is a significant struggle for both CPU and GPU. The m18 R1's cooling apparatus struggles when both the CPU and GPU are running all-out, and it shows in this result where the system barely bests the last-gen Razer Blade 17.
Intel UHD Graphics Integrated GPU Test
Intel puts some seriously speedy graphics processors into its laptop CPUs these days, but this is only a laptop CPU on a technicality. It's really a desktop CPU in all but name, and as a result, its integrated graphics are nothing to write home about. Still, we haven't tested a Raptor Lake GPU before, so we ran the Core i9-13980HX's integrated graphics through 3DMark's simplistic Night Raid test to see how it holds up.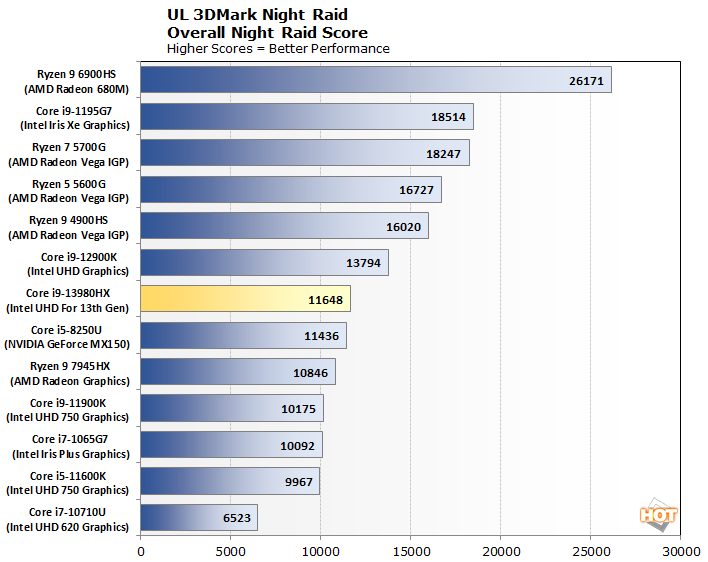
This is fundamentally the exact same GPU that is built into the Core i9-12900K that scores significantly better. The difference is primarily down to one thing: memory transfer rate. Our Core i9-12900K was using hot-clocked DDR5 memory, much faster than the baseline DDR5-4800 in this system. Still, the performance isn't terrible; you don't need to switch over to the GeForce GPU for anything besides intense 3D games.


